This HTML edition contains selectable text extracted from the original PDF. Layout-aware OCR was used to recover reading order, figures and equations; minor recognition errors may remain. Consult the PDF for the authoritative layout, figures and equations.
Themplies Corp. Ontario
Dec-3rd-7h 1975.

Reprint
of a Paper Presented
at a Technical Conference
of
THE INSTITUTION OF ENGINEERS, AUSTRALIA
Factors Affecting the Hydraulic Performance of Slurries
by
A. D. THOMAS, B.E.(Hons.), Ph.D.
M.D. Research Company Pty Limited
SUMMARY. Before a slurry pipeline can be optimised, the effect that changes in the solids concentration, the median particle size and the particle size distribution have on the hydraulic behaviour of the slurry must be known. This paper examines in turn the effects that changes in these three variables has on both the pressure gradient and the critical deposit velocity. The effects are discussed qualitatively and illustrated with experimental data for various slurries. Some available methods of predicting these effects are discussed but it is concluded that generally pipe loop tests are necessary if accurate predictions are required.
1 INTRODUCTION
The transport of coal and other minerals by pumping them along pipelines in slurry form is a proven commercial alternative to more conventional means of transport. The design of a slurry pipeline involves consideration of many factors such as concentration of solids, median particle size, particle size distribution, pipe diameter, operating velocity etc.
For a particular selected pipe diameter changes in the solids concentration, median particle size, and particle size distribution will all alter the hydraulic performance of a slurry. To optimise a pipeline design the effects that changes in the above variables have on the operating pressure drop must be known. The operating pressure drop is dictated by the necessity to operate at a velocity slightly above the deposit velocity. This generally necessitates operating in the turbulent regime although some slurries having a high proportion of very fine particles and a high concentration do operate successfully in the laminar regime. Obviously if two slurries have the same deposit velocity the most economic one is the one with the lowest pressure gradient at that velocity even though that slurry may have a higher pressure gradient than the other at higher velocities.
2 NOTATION
| C | Solids concentration-fraction by volume |
| D | Pipe diameter |
| f | Fanning friction factor |
| g | Gravitational acceleration |
| J | Pressure gradient of slurry |
| J het | Pressure gradient of a heterogeneous slurry |
| J hom | Pressure gradient of a homogeneous slurry |
| J w | Pressure gradient of water flowing at the same mean velocity as the slurry |
| S | Specific gravity of solids |
| V | Mean velocity of slurry |
| Density of water mixture | |
| Viscosity of mixture |
3 EFFECT ON PRESSURE GRADIENT AND DEPOSIT VELOCITY OF REDUCTION IN THE MEDIAN PARTICLE SIZE
(a) Effect on Pressure Gradient
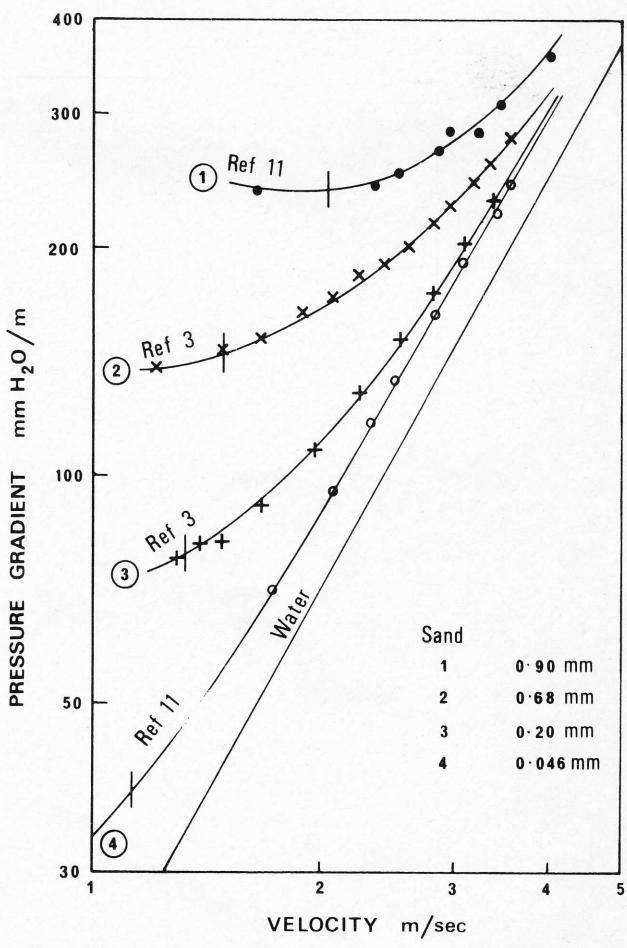
Fig. 1 Effect of changes in median particle size. Vertical lines indicate deposit velocities. D = 50 mm, C = 18%
Figure 1 shows experimental results for sand slurries of concentration 18% by volume in a 50 mm diameter pipe. It can be seen that as the median particle size is decreased the slurry behaves more homogeneously i.e., more as a single phase fluid. The operating point on each curve is determined by the deposit velocity which is that velocity at which the larger particles are no longer maintained in suspension and begin to form a stationary bed on the bottom of the pipe. It is advisable to operate at a velocity slightly (say 0.3 m/sec) above that velocity. Reducing the particle size from 0.9 mm to 0.046 mm has resulted in the operating velocity being reduced from 2.35 m/sec to 1.40 m/sec while the pressure gradient has been reduced by 80% from 240 mm /m to 49 mm /m. Obviously the use of fine particles results in considerable savings in pumping power. There is also a great reduction in pipe wear as the velocity and the particle size are reduced. However the above advantages of operating as a homogeneous slurry must be weighed against the cost of crushing and grinding the material and the possible disadvantages of such fine material as the end product. Generally speaking all long distance pipelines (say greater than 30 km) operate with homogeneous type slurries. Typical median particle sizes are 30 microns for iron ore ( ) and 200 to 300 microns for coal ( ). The effect of changes in the median size of coal particles is illustrated in Figure 2 for a volume concentration of 45% in a 160 mm pipe. Reducing the median size from 4.3 mm to 0.25 mm has reduced the operating velocity from 3 m/sec to 1.7 m/sec and the pressure gradient from 97 mm /metre to 31 mm /metre.
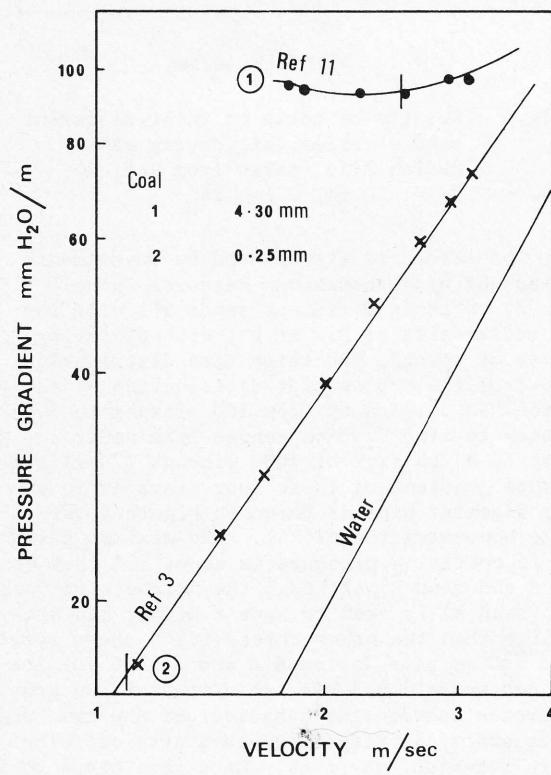
Fig. 2 Effect of changes in median particle size. Vertical lines indicate deposit velocities. D = 160 mm, C = 45%
Although the above examples illustrate the desirability of fine particles it does not follow that the optimum slurry is the one with the finest possible particles. Once the particle size is reduced below about 10 microns colloidal effects cause increasingly important and these may become a large increase in viscosity. Not only does this increase in viscosity mean larger pressure gradients even though the slurry is behaving homogeneously but it also means that the velocity at which the transition to laminar flow occurs is raised. The possible effect of reducing the particle size too much is shown schematically in figure 3.
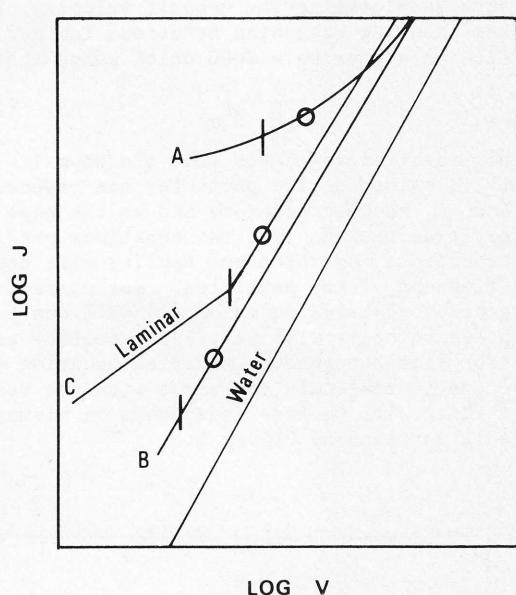
Fig. 3 Schematic diagram indicating disadvantages of too fine particles. Vertical dashes indicate deposit velocities, Rings indicate operating velocity.
Reducing the particle size from that of curve A to that of curve B has resulted in a reduction in the operating velocity and pressure gradient. Further size reduction has resulted in a laminar transition velocity with the consequent higher operating velocity and pressure gradient. The onset of colloidal effects may also signify the start of non-Newtonian behaviour whereby the slurry may exhibit an appreciable yield stress. Such behaviour will complicate the simplified approach of Figure 3 but the general fact remains that there is a lower limit to particle size as far as optimum slurry performance is concerned. However some colloidal effects, and consequent increased viscosity, can be beneficial in reducing the settling tendency of the large particles. Most commercial long distance pipelines operate as homogeneous slurry with amount of non-Newtonian behaviour. The proportion of fine particles necessary to achieve this balance depends on the specific gravity of the forces and their surface chemical properties. For coal it has been found that it is necessary to have about 15 to 25% of the particles less than 325 mesh (44 microns).
Since the deposit velocity dictates the operating point it is desirable to know how changes in particle size will affect the deposit velocity: For coarse heterogeneous slurries (Ref. 1)
where is a function of particle size and is smaller for reduced particle size. This equation indicates that the deposit velocity is lower for smaller particles and smaller pipe diameters. On the other hand for homogeneous type slurries the transition to laminar flow becomes of increasing importance in dictating the deposit velocity. In this case assuming Newtonian behaviour laminar transition occurs at which means that
This equation indicates that the deposit velocity is raised as the particles are reduced in size (and becomes greater) and as the pipe diameter is decreased. The two equations predict effects and which one applies will depend on the fineness of the particles. For coarse, heterogeneous slurries equation (1) will apply and the deposit velocity will approximately as . For fine homogeneous slurries equation (2) will become increasingly important with the result of that there will be less dependence on diameter. This is illustrated by Figure 4.
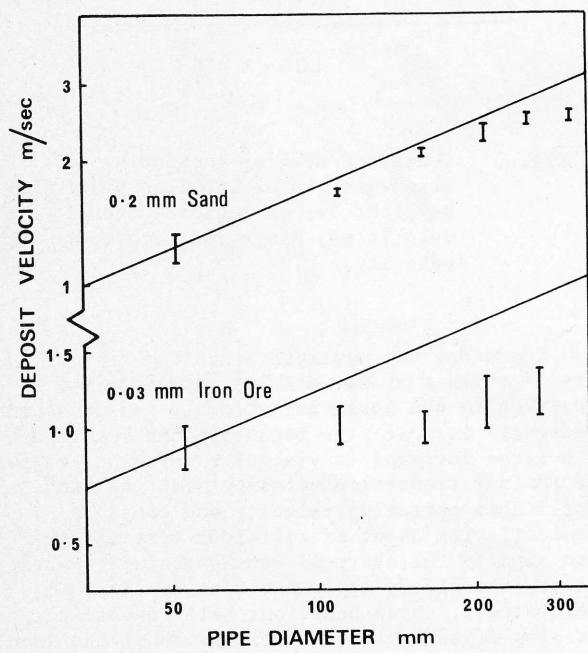
Fig. 4 Variation of deposit velocity with pipe diameter - two types of slurries. From Ref. 3
The deposit velocity of sand, having a median size of 0.2 mm (equivalent to coal of about 1 mm say) varies approximately as in agreement with equation (1). The results for a fine iron ore slurry of median particle size 30 microns (equivalent to coal of about 0.200 mm say) show how the opposing effect of equation (2) has reduced the diameter dependence such that the deposit velocity is almost independent of diameter.
(a) On Pressure Gradient
The previous section has discussed the effect of changes in the median size. The question arises as to what is the effect of altering the size distribution. Experimental data is scarce but from the little that there is available it appears that providing the Rosin-Rammler distribution (Ref. 2) as produced by most crushing and grinding operations the operating pressure drop will be roughly the same for all distributions having the same median size.
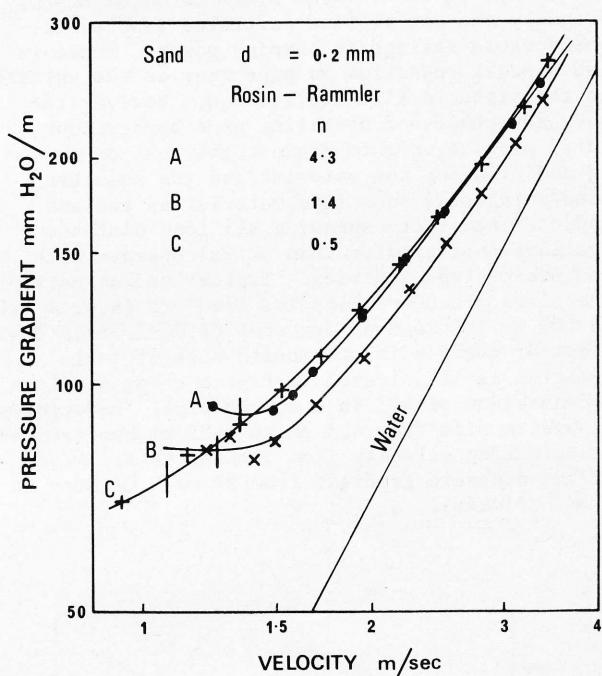
Fig. 5 Results of tests on three different sand slurries, all having same median size (taken from Ref. 3)
D = 50 mm, C = 24%
The effect is illustrated by experiments carried out by Saskatchewan Research Council (Ref. 3) on three different sands all with the same median size of 0.2 mm but with differing amounts from the narrow three distributions of sand A which has a range of from 100 microns to 300 microns, to sand C which ranges from under 1 micron to a top size of 7000 microns (7 mm). The pressure gradient of these four slurries in a 50 mm diameter pipe is shown in Figure 5 for a volume concentration of 24%. The maximum difference in operating pressure is about 15% (between sand A and sand B) although the narrow deposit velocity than the other three. Fig 6 shows results for a 250 mm pipe for sand A and sand B for the same concentration. Once again there is no great difference between the behaviour of the two sands. In the practical situation one starts off with coarse material, say coal, which then needs to be crushed to allow pipelining. If the discussion is confined to long distance applications this means that one is aiming for homogeneous type behaviour with a small amount of newtonian properties. As mentioned previously for coal this means a median size of 200 to 300 microns with about 15% to 25% less than 325 mesh (44 microns). Using
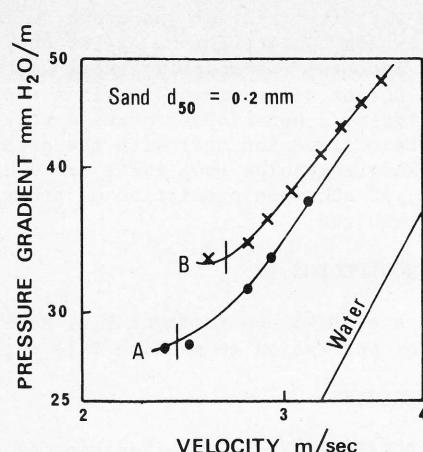
Fig. 6 Results of tests on two different sands having the same median size ,
average values of 250 microns for the and 20% less than 44 microns the Rosin-Rammler distribution is such that only 2% of particles are greater than 3 mm. This is fortunate since the reciprocating pumps used in long distance applications can generally not handle particles greater than about 3 mm. Of course other factors such as coking properties for coking coal may make it desirable to operate with a coarser particle size.
(b) On Deposit Velocity
The effect that changes in the particle size distribution have on the deposit velocity has received little attention in the literature. The results of Fig. 5 show that for a sand slurry of median particle size 0.2 mm a moderate width size distribution (sand B) had a lower deposit velocity than the narrow size sand (sand A) but not as low as the wider size sand. However sands A and B when tested in a 250 mm pipe showed the reverse result and sand A had the lowest deposit velocity. (Fig. 6) The differences are not large however and as with the pressure gradient, providing the Rosin-Rammler type distribution is followed the median particle size is probably the dominating factor determining the deposit velocity.
(c) The Effect of Particle Size Distribution on Dense Phase Slurry Behaviour
As the concentration of a slurry is increased to very high values approaching the maximum packing density the region termed dense phase behaviour is reached. At these concentrations (above about 50% by volume) most slurries will flow in laminar flow without settling occurring even at very low velocities. It is associated with the pressure gradients associated with such concentrations as too high for practical applications. However an interesting paper by Elliot & Glidden (Ref. 4) showed that the pressure gradient could be reduced by adjusting the size distribution. They found that the size distribution which gave the minimum voidage also gave the lowest pressure gradient. Since this paper was published there does not appear to have been any further work done on this interesting aspect of slurry behaviour.
5 THE EFFECT OF CHANGES IN CONCENTRATION
(a) The Effect of Concentration Changes on the Pressure Gradient
As the concentration is increased the pressure gradient will increase for coarse particles (say greater than 1 mm for coal). Evidence suggests that the incremental increase in pressure gradient above that for water flowing alone at the same velocity is directly proportional to the volumetric concentration. Equations of the Durand type (Ref. 1) assume such a relationship. For a particular slurry the Durand equation is given by
As the particle size is progressively reduced the slurry will behave more homogeneously until eventually it will behave like a single phase Newtonian fluid. Equation (3) can not be applied to such a slurry. For such a slurry single phase Newtonian methods can be used to describe the behaviour.
where is the Fanning friction factor and depends on the Reynolds Number. For low concentrations and providing there are very few fine particles it often occurs that the increase in viscosity is about the same as the increase in density so that the Reynolds Number remains the same (4) indicates that
which is similar to equation (3) for particular slurry, pipe diameter and velocity.
Equations (3) & (5) describe the flow of heterogeneous and homogeneous slurries respectively and there are no colloidal effects. For slurries of particle size such that the behaviour is between these two extremes it has been suggested (Ref. 5) that the simple addition of equations (3) and (5) adequately describe the behaviour
Obviously this equation still retains the linearity with respect to concentration. For higher concentrations and when very fine particles are present no such linear relationship will exist although often the error in assuming linearity is not great.
(b) The Effect of Concentration Changes on the Deposit Velocity
For a heterogeneous type slurry where equation (1) applies changes in concentration have little effect on the deposit velocity. This is illustrated in Fig. 4 by the sand slurry results. The range of deposit velocities shown covers concentrations from 12% to 36%. However if the slurry is a homogeneous type and if the concentration is high enough equation (2) will become important and the deposit velocity will then increase with increasing concentration because of the necessity to operate in the turbulent regime. Of course if no deposition occurs under laminar flow then operation in that regime is entirely feasible. Generally this requires extremely fine particles although it can occur for coarser particles providing the concentration approaches the maximum packing density. This is the region of dense phase transport.
6 AVAILABLE METHODS OF PREDICTING SLURRY BEHAVIOUR
(a) Pressure Gradient Prediction
Methods of predicting the pressure drop of slurries are still far from satisfactory especially if large diameter pipes are involved. Heterogeneous or semi-heterogeneous slurries would not normally be considered for long distance applications but are used over short distances. Equations of the form of equation (6) can be used for those slurries and methods described in refs.(5) and(6) are of some use. However the different methods often give widely varying estimates and pipe loop tests are usually needed if an accurate prediction is required. If the pipe loop tests are performed in pipes of smaller diameter than that proposed the results must be scaled up to larger diameters. A recent paper by the author (Ref.7) reviews available scale-up methods and proposes a comprehensive scale-up procedure suitable for all types of slurries.
For long distance pipelines economic considerations generally dictate that the slurries be homogeneous i.e., pseudo single phase fluids exhibiting either Newtonian or non-Newtonian behaviour. If reliable viscometer tests are available there are a number of methods which will allow prediction of pipeline behaviour. Most of these methods are discussed by Kenchington (Ref.8). He concluded that the prediction of the turbulent pressure drop by these methods was probably accurate enough although prediction of the transition velocity was not so reliable. For a viscous high concentration slurry where the transition velocity is in the velocity range of likely operation this is a serious shortcoming. Kenchington recommends a combination of viscometer methods and pipe loop tests. Scaling up of pipe loop tests on homogeneous slurries is best done using the method proposed by Bowen (Ref.9). Examples of the use of the bowen scale-up method are given in Bowens original papers and in Refs.7 and 8.
(b) Deposit Velocity
There have been a multitude of methods proposed for prediction of the deposit velocity of heterogeneous and semi-heterogeneous slurries. Fifty five of these methods have been recently discussed by Carleton and Cheng (Ref.10) among them the method proposed by Durand (equation 1). They concluded that at present there is no reliable method available. Once again pipe loop tests are invariably required for accurate estimation. For homogeneous slurries the laminar transition velocity generally coincides with the deposit velocity so that the remarks made in the previous section are relevant i.e., that for accurate determination of the transition velocity pipe loop tests are generally necessary.
7 CONCLUSIONS
The general behaviour of slurries has been described and the qualitative effect of changes in the median particle size, particle size distribution and concentration are discussed. As the median particle size is reduced a slurry behaves increasingly more like a homogeneous fluid. Pseudo-homogeneity is reached at median particle sizes ranging from about 250 microns for coal to about 30 microns for iron ore. The median particle size was seen to largely dictate the type of slurry behaviour and changes in the particle size distribution whilst maintaining the same
median size were shown to be of secondary importance. The pressure gradient was shown to increase with increasing concentration. At low concentrations this increase was roughly linear with concentration but at higher concentrations and with finer particles a non-linear increase would occur. The discussion revealed that with the present state of knowledge pipe loop tests are usually necessary, if accurate prediction of slurry behaviour is required.
8 ACKNOWLEDGEMENTS
The author wishes to thank M.D. Research Company for permission to publish this paper.
9 REFERENCES
- 1. DURAND,R. Basic Relationships of the Transportation of Solids in Pipes-Experimental Research. Proc. Int. Assoc. for Hyd. Research, Uni. of Minnesota, Sept 1953, pp. 89-103.
- 2. ROSIN,P and RAMMLER,E. The Laws Governing the Fineness of Powdered Coal . The Institute of Fuel, Oct. 1933 pp. 29-112.
- 3. EXPERIMENTAL STUDIES ON SOLIDS PIPE-LINING OF CANADIAN COMMODITIES. Series of reports by Saskatchewan Research Council for Canadian Transport Commission and the Transportation Development Agency . 1973/1974.
- 4. ELLIOT,D.E. and GLIDDON,B.J. Hydraulic Transport of Coal at High Concentrations . Proc. 1st Int. Conf. on the Hyd. Transport of Solids in Pipes (Hydrotransport 1) Paper G2, Organised by B.H.R.A. and held at Uni. of Warwick, U.K. (1st-4th Sept) 1970.
- 5. CHARLES,M.E. Transport of Solids by Pipe line Hydrotransport 1 Paper A3.
- 6. WASP,E.J. AUDE,T.C., SEITER,R.H. and THOMPSON,T.L. Hetero-Homogeneous solids-Liquids Flow in the Turbulent Regime Int. Symp. on Solid-Liquid Flow in Pipes and its Application to Solid Waste Collection and Removal, Philadelphia,Penn., U.S.A. (4th-6th March 1968).
- 7. THOMAS,A.D. Scale-up Methods for Pipe-line Transport of Slurries . To be published in Int. J. of Min. Processing.
- 8. KENCHINGTON,J.M. The Prediction of Pressure Drop in Slurry Pipelines . Multiphase Systems Symp. Org. jointly by I.Chem. E. & I. Mech.E., Paper II, Uni. Strathclyde, U.K. April 1974.
- 9. BOWEN,R.L.(Jnr), 1961, Series of articles in Chem. Engng., June 12, p.243, June 26, p.127, July 10, p.147, July 24, p.143, Aug 7, p.129, Aug 21, p.119, Sept 4, p.131.
- 10. CARLETON,A.J. and CHENG,D.C.H. Design Velocities for Hydraulic Conveying of Settling Suspensions . Hydrotransport 3, Paper E5,Colorado School of Mines,Golden, Colorado, 15th-17th May 1974.
- 11. THOMAS,A.D., Unpublished work at M.D. Research Co.