This HTML edition contains selectable text extracted from the original PDF. Layout-aware OCR was used to recover reading order, figures and equations; minor recognition errors may remain. Consult the PDF for the authoritative layout, figures and equations.
Hydrotransport 5
PAPER D5
FIFTH INTERNATIONAL CONFERENCE ON THE
HYDRAULIC TRANSPORT OF SOLIDS IN PIPES
MAY 8th-11th, 1978
COARSE PARTICLES IN A HEAVY MEDIUM - TURBULENT PRESSURE
DROP REDUCTION AND DEPOSITION UNDER LAMINAR FLOW
A.D. Thomas
M.D. Research Co. Pty. Ltd., Australia
Summary
Pipe loop tests were performed on different size sands and coals in heavy clay /water media in both the turbulent and laminar flow regimes. The turbulent flow data enabled a pressure drop reduction phenomenon, previously observed with discrete particles in water, to be investigated. It is shown that the addition of coarse particles to a heavy medium can result in a lower pressure drop if the same quantity of fine particles were added. This effect occurs in the pseudo-homogeneous flow regime and is explained in terms of the ratio of the particle size to the viscous sub-layer thickness.
The laminar flow data include flow with and without deposition. A dimensional analysis of the relevant variables has enabled this data and data from the literature to be correlated. The result is a criterion for deposition of coarse particles during laminar flow, which is relevant to the so called "dense phase transport" concept.
Grobkörnige Feststoffe in einer zähen Trübe - Verringerung des Druckverlustes bei turbulenter Strömung und Feststoffablagerung bei laminarer Strömung
Kurzfassung
Grundlage des Vortrags sind Rohrkreislaufversuche mit Sand und Kohle verschiedener Korndurchmesser in Flüssigkeiten aus einem Ton-Wasser-Gemisch; die Versuche wurden sowohl bei turbulenter wie auch bei laminarer Strömung durchgeführt. Die Daten für turbulente Strömung ermöglichten eine Untersuchung der Verringerung des Druckverlustes, ein Phänomen, das früher bei Einzel-Teilchen im Wasser beobachtet worden war. Es wird gezeigt, daß der Zusatz von grobkörnigen Feststoffen zu einer zähen Flüssigkeit eine Verringerung der Druckverluste verursachen kann, genauso als wenn dieselbe Menge feinkörniger Feststoffe beigefügt worden wäre. Diese Wirkung tritt unter pseudohomogenen Strömungsbedingungen auf und läßt sich durch das Verhältnis der Feststoffgröße zur zähflüssigen Grenzschichtdicke erklären.
Die Daten laminarer Strömung umfassen Strömungen mit und ohne Ablagerung. Eine Dimensionsanalyse der relevanten Variablen hat dazu geführt, daß diese Daten vergleichbaren Forschungsergebnissen aus der Literatur gegenübergestellt werden konnten. Die Ergebnisse sind ein Kriterium für die Ablagerung grobkörniger Feststoffe bei laminarer Strömung, das für das Konzept des hochkonzentrierten Transports von Belang ist.
Held in Hannover, Federal Republic of Germany.
Conference Organised by BHRA Fluid Engineering, Cranfield, Bedford, England
in conjunction with the Franzis Institute of the Technical University of Hannover.
NOMENCLATURE
| C | Volumetric Concentration of discrete particles in water or heavy medium. |
| C m | Volumetric solids (clay) concentration of heavy medium. |
| D | Pipe diameter. |
| d | Particle size. |
| d 50 | Median particle size. |
| f | Fanning friction factor ( = ). |
| g | Gravitational constant. |
| L | Axial length of pipe. |
| N B | Modified Shields' number for Bingham plastics, defined by equation 7. |
| ΔP | Pressure difference. |
| Re B * | Modified Shields' Reynolds number for Bingham plastic, defined by equation 7. |
| V | Mean flow velocity. |
| V* | Friction velocity ( = V ). |
| W | Settling velocity of a single particle in water. |
| δ | Thickness of the viscous sub-layer, defined by equation 1. |
| η m | Plastic Bingham viscosity of heavy medium. |
| μ | Dynamic Newtonian viscosity. |
| ρ | Density. |
| ρ m | Density of heavy medium. |
| ρ p | Density of solid particles. |
| τ m | Wall shear stress of heavy medium at same apparent shear rate 8V/D. |
| τ om | Bingham yield stress at zero shear rate of heavy medium. |
*Note: All concentrations are by volume. The clay concentrations refer to volume concentration of clay in water. The sand or coal concentrations also refer to volume concentration in water (prior to the addition of dry clay) unless otherwise stated.
1. INTRODUCTION
Most of the literature on hydraulic transport of solids has been concerned with slurries consisting of either coarse particles in water with settling tendencies or else micron sized particles where surface chemical forces, causing some degree of flocculation, prevent settling. The former type have been the subject of much research the classic paper being due to Durand (Ref. 1). Similarly, the latter type, which can be analysed as pseudo single phase non-Newtonian fluids, have also received much attention. However, most industrial slurries possess both coarse and fine particles and so can be envisaged as coarse particles suspended, not in water, but in a fine particle slurry or heavy medium as has been noted by Kenchington (Ref. 2) and Wasp et al (Ref. 3). In the latter reference the heavy medium or "carrier" is considered to have Newtonian properties but in a recent paper the author (Ref. 4) has argued that with most industrial slurries the heavy medium portion will possess a yield stress and in fact has argued that, in the case of long distance pipelines, to obtain a stable slurry for start-up purposes a yield stress is essential. These slurries, therefore, need to be considered as coarse particles in a non-Newtonian heavy medium. The few papers which have been published on this topic (Ref. 2, 5, 6) have mostly been concerned with deliberately replacing water with a heavy medium to reduce the settling tendency of heavy particles, often to enable transport under laminar flow conditions - the so called "dense phase concept".
The purpose of the present paper is to present experimental evidence and propose possible explanations for two phenomena which arise from considering industrial slurries as coarse particles suspended in a heavy medium. The first of these is the reduced turbulent pressure gradient observed with slurries of coarse particles in a heavy medium compared to that observed with fine particles in the same heavy medium. This offers the prospect of reducing the turbulent pressure drop of slurries by manipulation of the particle size distribution.
The second part of the paper concerns deposition under laminar flow and the slurry properties required to avoid such deposition. This is important with regard to the so called "dense phase concept" as reported by Elliott & Glidden (Ref. 5).
2. PARTICLE SIZE-EFFECT ON TURBULENT FLOW FRICTION DROP
The turbulent flow in horizontal pipes of suspensions of discrete settling particles in water has been the subject of much research. Typical hydraulic behaviour of these suspensions is an increasing excess pressure gradient over that for water as the flow velocity is decreased. Conversely, as the velocity is increased the hydraulic behaviour becomes more like that of a single phase fluid.
For discrete settling particles in water the velocities, and hence, pressure gradients, required to reach this pseudo-homogeneous flow regime are generally too high to be of commercial interest. For this reason, the behaviour of slurries in this literature as to whether the slurry pressure gradient asymptotically approaches the water value, as is indicated by Durand (Ref. 1) type of equations, or parallels the water value (on a log-log plot of pressure gradient versus velocity) as has been suggested by a number of authors including Vocadlo & Charles (Ref. 7). In a recent paper the author (Ref 8) has considered this region and argued that the behaviour at high velocities depends on the ratio of particle size to the viscous sub-layer thickness, , where is given by
Briefly, the argument advanced was that if particles are much smaller than the viscous sub-layer then they will increase the effective viscosity in the wall region thereby causing a higher pressure gradient than that for water. Conversely, it was argued that coarse particles, much larger than the viscous sub-layer, could not affect the viscosity in the wall region so that the pressure gradient was essentially the same as for water flowing alone. The author (Ref. 8) showed that in order to obtain this pressure reduction effect with coarse particle slurries
For the flow of neutrally buoyant particles in horizontal pipes and for the flow of settling particles in vertical pipes the pseudo-homogeneous region is attainable at low flow velocities, so both these flow situations are relevant. It was shown that the concept is consistent with the observed behaviour in these two situations and indeed the importance of the ratio has been recognized by various authors in these two areas, e.g. Maude & Whitmore (Ref. 9), and Daily and Roberts (Ref. 10).
In horizontal pipes it is generally agreed that the ratio of particle settling velocity to the friction velocity is a significant parameter in determining the degree of homogeneity. D.G. Thomas (Ref. 11) argued that for values of the flow could be considered homogeneous while Wasp et al (Ref. 12) have indirectly indicated a value of approximately 0.11 as being a suitable demarcation, i.e. for pseudo-homogeneous flow to be reached
Considering a typical friction factor of 0.003 in large steel pipes and a typical maximum velocity of , this criterion gives . This represents typical maximum particle sizes of 0.44 mm for coal, 0.18 mm for silica sand and 0.11 mm for iron ore.
3. APPLICATION TO COARSE PARTICLES IN A HEAVY MEDIUM
Coarse particles in any Newtonian fluid would be expected to exhibit this pressure gradient reduction effect. Indeed the author (Ref. 8) made use of data obtained by Shook et al (Ref. 13) for different sands in viscous liquids other than water. However industrial slurries can often be considered as coarse particles suspended in a non-Newtonian heavy medium, so it was necessary to determine whether this effect also occurred in this case. There is little suitable data in the literature although the tests repertoired by Kenchington (Ref. 2) on a coarse sand suspended in a clay suspension are relevant. Reference to Figure 3 of his paper shows that the turbulent pressure gradient actually dropped when the sand was added to the clay which is contrary to what would normally be expected, and suggests that this effect might be responsible.
It is generally agreed that flocculated suspensions of fine particles possess a yield stress and so these heavy media can often be modelled using a Bingham plastic rheological model, the appropriate parameters being the yield stress, and the plastic viscosity, . The yield stress has a strong effect on the laminar flow behaviour of a Bingham plastic but in turbulent flow its effect is much less. D.G. Thomas (Ref. 14) has stated that there is a thickening of the viscous wall layer with increasing non-Newtonian character. However, for the slurries he tested the amount of thickening was relatively small, being a maximum of 1.43 times the Newtonian value, so it will be neglected here. He indicated that in calculating the appropriate viscosity to use was the limiting viscosity at high rates of shear (greater than ). Unfortunately, these high shear rates were not attainable in the present study, so it was not possible to determine the limiting viscosity. Instead, the plastic viscosity, , has been used to calculate . This will tend to underestimate the ratios.
The calculated values of for the 13 mm pipe data of Kenchington (Ref. 2) lie in the range 3 to 6 which suggests that the low pressure gradient observed by him might be explained by a effect.
To further investigate whether the pressure reduction effect previously observed also occurred with non-Newtonian heavy media, pipeloop tests were carried out on various sands and coals in heavy media of clay and water. The size distributions of the materials used are shown in Fig. 1.
4. PIPE LOOP DETAILS
Two pipe loops were used with diameters of 18.9 mm and 105 mm. Both were conventional open circuit types involving straight horizontal lengths of pipe, 2 x 4 m and 2 x 33 m respectively. The pressure gradient was measured over 1 m and 13 m lengths respectively, by pressure tappings feeding a differential pressure transducer.
Volume flow rate was measured by diverting the flow and measuring the time taken to fill a known volume. The weight of this volume of slurry was also measured in each case, enabling the concentration of solids to be determined. In the case of the clay suspensions used for the heavy media the concentration was also determined by weighing a sample before and after drying. Slurry temperature was maintained in the range 18 to 22°C by cooling coils. Further details of the loops are given in Ref. 15.
5. TESTS IN 18.9 mm PIPELOOP
Figure 2 shows pressure gradient/velocity plots for fine ( mm) and coarse ( mm) sands in a clay/water suspension. The particle size distributions of these two sands are given in Figure 1 and pertinent data is provided in Table 1. Comparing the turbulent flow behaviour of the two sands the fine one is seen to roughly parallel the clay only result while the coarse one appears to approach the clay only result as the velocity increases. At low velocities the pressure gradient of the coarse slurry was higher than the fine particle one due to the greater settling tendency of the coarse particles. The dip in the pressure gradient curve of the fine sand at around marks the transition region between laminar and turbulent flow. However, the high velocity region is of most interest and above the coarse sand is seen to give a pressure gradient some 12% below that of the fine sand. This is in spite of the fact that both the concentration of sand and the density of the overall slurry were less in the case of the fine sand slurry. Admittedly, the clay concentration is slightly higher for the fine sand but a comparison of the turbulent pressure gradients of the clay alone show a difference of only around 3%.
The lower pressure gradient of the coarse sand can be explained by considering the ratios for the two sands. Using the plastic viscosity of the clay suspensions to calculate it can be shown that the maximum value of (at ) for the fine sand is 1.3, well below the value of 5 which needed to be exceeded before pressure reduction was obtained in water. In contrast, the ratio for the coarse sands exceeds a value of 5 for velocities in excess of , so the pressure gradient at velocities above this would be expected to approach the clay only pressure gradient, as is indeed the case.
A similar effect has been obtained in the 18.9 mm pipe loop with a number of combinations of sand and clays. For example, a 5% concentration of the same clay ( ) with a 35% concentration of 0.375 mm sand gave a pressure gradient virtually identical to that of the coarse sand in Figure 2 for velocities above . Considering the density of the slurry ( ) this result was some 30% below what could normally be expected. Once again, this low pressure gradient could be explained by the fact that the ratios were greater than 5.
6. TESTS IN 105 mm PIPE LOOP
6.1 Preparation for Tests. For these tests it was desirable that the properties of the heavy medium should be the same for the different size materials and so a China clay was chosen as the heavy medium. Further, to ensure that the rheological properties of the clay were not affected differently for different sorts of materials added it was necessary to avoid adding any particles of coal or sand which were small enough to themselves flocculate. Therefore, the two sands and the coals were purposely chosen to have as few minus 0.100 mm particles as possible. With this precaution it was hoped that any contribution to the laminar flow properties of the heavy medium due to the addition of sand and coal would be only due to mechanical effects, similar to that observed with rigid particles in water, rather than any extra surface electrochemical effects. Such mechanical effects, in Newtonian fluids at any rate, are generally regarded as being independent of particle size and density, although they are known to vary with packing density. (Ref. 16). Providing therefore, that the particle size distributions and shapes are the same in all cases the laminar flow behaviour should be the same regardless of particle size and solids density for the same volume concentration. The turbulent pressure gradient is also known to be affected by the size distribution (Ref. 16) but only at high concentrations. At the concentrations to be employed here (around 18%) the effect is relatively small. Nevertheless, to avoid any distortions due to this effect similar size distributions were required for the fine and coarse particles. The resulting two sands ( values of 0.18 and 0.82 mm)
and two coals ( values of 0.43 and 2.3 mm) had size distributions shown in Figure 1. The two sands had much narrower distributions than the two coals but since comparisons will only be made between fine and coarse particles of the same material this is not important. The particle shape of the two sands was known to be approximately similar. The two coal particle shapes obtained by screening a mm coal over a 1 mm screen, so that the particle shapes for the two coals should be identical. One further advantage of obtaining the two coals from the same original coal sample was that any fine coal produced by degradation during the pipe loop tests would have similar electro-chemical properties. However, to minimise degradation the tests were conducted as quickly as possible. In spite of this some increase in minus 0.100 mm material did occur during the tests but a similar amount for both coals and then only of the order of 5 percentage points increase, i.e. increasing the amount of minus 0.10 mm material from 2.5 to 7.5% for the coarse coal and from 7 to 12% for the fine coal. This is not thought to have any significant effect on the results.
The density of the sands was and of the coal .
6.2 Rheological Properties of Clay. The clay chosen was a China clay, "Eckalite 2", produced by Kaolin Industries Ltd., Pittong, Victoria. The rheological properties of this clay at various concentrations were determined from tests in the 18.9 mm pipe loop, and by Tuft (Ref. 17) in a vertical tube viscometer using two tubes 4.8 and 7.2 mm in diameter. In addition, results were obtained for a number of concentrations in the 105 mm pipe. Excellent agreement was obtained between all pipe sizes. For example, for measured concentrations of 7.49%, 7.49% and 7.39% in the 7.2 mm, 18.9 mm and 105 mm pipe sizes respectively there was a maximum variation of 3.7% in the measured wall shear stress, , for the same apparent shear rate, 8V/D. The data was fitted to a Bingham model and the maximum scatter about the fitted curve was less than %. This can be considered evident agreement over the quite large pipe diameter ratio of 15 to 1, with no evidence of any "slip" effects as have been reported by a number of authors including Kenchington (Ref. 18).
Figure 3 shows the variation with concentration of the Bingham parameters, and . The yield stress is seen to vary approximately as concentration raised to the power 2.5 which is not too different from the cubed relationship predicted by D.G. Thomas (Ref. 19) but the exponential variation of plastic viscosity suggested by him does not apply.
6.3 Turbulent Flow Results for Two Sands and Two Coals in Clay Suspension. Figures 4 to 7 show the results obtained in the 105 mm pipe loop. Although, a nominal concentration (in water) of 18% was aimed for, the actual concentrations obtained were 16.8% and 18.5% respectively for the fine and coarse sands and 19.9% and 21.2% for the fine and coarse coals. The tests were conducted by first obtaining a certain concentration of clay in water in the pipe loop. Tests were usually performed on this clay slurry and then a sample taken for accurate concentration determination. Then the sand or coal was added and tests performed. Higher clay concentrations were achieved by adding known quantities of dry clay to the system. This meant that as the clay concentration increased the concentration of sand or coal in the clay suspension decreased slightly. The greatest decrease was 1.4 percentage points which occurred with the coarse coal. In this case the concentration changed from 21.2% in water to 19.8% in the heavy medium at the highest clay concentration of 7.95%.
Consideration of equations 1 and 2 along with Figure 3 will show that for the range of velocities and clay concentrations tested the pressure reduction effect would be expected for the coarse coal at all concentrations and all velocities where pseudo-homogeneous flow is evident (i.e. above ). At the single concentration tested with the coarse sand exceeds 5 only for velocities above . For the fine sand is always less than 5 so no pressure reduction would be expected. In the case of the fine coal is less than 5 for all except the lowest clay concentration tested (4.67%). For this concentration exceeds 5 for velocities greater than .
A comparison between the turbulent pressure gradients obtained with the fine and coarse coals (Figs 6 and 7) shows that the expected behaviour does indeed occur. For the three highest concentrations of clay with coarse coal the pressure gradient is
some 10% less than the equivalent concentrations with fine coal in spite of the slightly higher concentration of the coarse coal (21.2% c.f. 19.9%). In addition, the lowest concentration results for the fine coal indicate a low pressure gradient at high velocities but increasing relatively as the velocity is decreased, exactly as expected from a consideration of the d/ values.
In the case of the fine and coarse sand the results are less conclusive. As expected the fine and coarse sand show no evidence of any pressure reduction for any of the concentrations tested. For the coarse sand pressure reduction was expected at high velocities but none is evident, the pressure gradients being the same as obtained with the fine sand. However, because of the settling nature of the coarse sand, the pseudo-homogeneous region is barely reached even at the highest velocities. This may explain why no pressure reduction was observed.
6.4 Laminar Flow Results. The laminar flow results are of considerable interest and will be used in the second part of this paper to develop a criterion for deposition under laminar flow conditions. For the present, they should also allow some check of the anticipated concentrations size independence of the laminar flow behaviour. Unfortunately, at clay particles only marginally sufficient to prevent deposition the flow was observed to be markedly "heterogeneous" in that there were pronounced vertical concentration and velocity gradients across the pipe section. Just as with turbulent "heterogeneous" flow such behaviour results in increased pressure gradients. Nevertheless, comparisons can be made at the higher clay concentrations. For example, the fine and coarse sands at the highest clay concentrations give similar pressure gradients, within 20% of each other. These are some 1.6 to 2 times the pressure gradients of the equivalent concentration of clay alone. As expected, the two coals give lower pressure gradients than the two sands. For instance, the pressure gradient of the fine coal is less than half that of the sands. Comparison between the two coals shows similar pressure gradients of the coal plus clay than the clay alone. This is evident with both coals and is perhaps due to disruption of the floc structure by the coal particles.
7. APPLICABILITY OF PRESSURE REDUCTION EFFECT.
The tests in the two pipe loops appear to confirm the expected lower turbulent pressure gradients with coarse particles. However, in both pipe loops it was only seen to occur above the rather high velocity of . This points to a limitation to the range of application of the pressure reduction phenomenon. Comparing equations 1 and 2 it can be seen that for any given particle size and flow velocity the slurry needs to be made less viscous to obtain the higher d/ ratios required. However, a further requirement is that pseudo-homogeneous flow must be obtained and from equation 3 this requires an increase in viscosity. Thus the two requirements of equations 2 and 3 are to some extent conflicting and place restrictions on the applicable particle sizes and flow velocities. Assuming the particles settle according to Stokes' law equations 1, 2 and 3 can be used to calculate particle sizes and friction velocities below which the pressure reduction effect cannot be realised. Figure 8 is such a plot for some representative solids densities and heavy media viscosities. Also given on the abscissa scale are equivalent velocities for different values of friction factor. For example, to obtain the pressure reduction effect for sand in a heavy medium exceed and the particle size must be greater than 0.43 mm. For a pipe size of 300 mm this represents a velocity of around . Operation of a long distance slurry pipeline at velocities much above is generally uneconomic (Ref. 4), so it appears from Figure 8 that the only commodity for which this pressure reduction concept has possibilities is coal and even then the velocities appear too high.
Figure 8 applies to a density of . For heavy media densities greater than this the velocity required is lower. For single component slurries the heavy medium is obtained by grinding a portion of the solids very fine. Assuming one third of the solids could make up the heavy medium and using a typical total concentration of 40% this means that the density of the heavy medium would be around , and for coal, silica and iron ore respectively. Consideration of equations 1, 2 and 3 will show that these respective values for the density of the heavy medium
make little difference and there still appears only limited scope for its application.
However, it must be remembered that Fig. 8 is based on equation 3 which is only an approximate relationship which has not been extensively tested, especially in non-Newtonian heavy media. Furthermore, it is not clear how the particle settling velocity, , should be calculated for the case of turbulent flow of such media. If it is assumed that can be calculated as for a Newtonian fluid of viscosity equal to equation 3 can be applied, using the value as a representative particle size in each case. For the lowest clay concentration in each case this results in required velocities of 1.7 and 13 for the fine and coarse sands respectively and 1.3 and 15 for the fine and coarse coals respectively. Comparison with Figs. 4 to 7 shows that these estimates are far too high, especially for the coarse particles. It is possible therefore, that Fig. 8, based on equation 3, may be unduly pessimistic regarding the possibilities of exploiting this pressure reduction effect. Further work needs to be done to allow more exact delineation of the requirements.
One situation where it would definitely seem useful is where the slurry consists of two commodities e.g. coarse coal in a heavy medium of clay or perhaps iron ore. Then relative densities of the coarse solids to the heavy medium can be reduced sufficiently to allow operation at economic flow velocities.
8. DEPOSITION UNDER LAMINAR FLOW CONDITIONS
The laminar flow results of Figures 4 to 7 provide valuable data to study deposition under laminar flow. The experiments of Elliott & Glidden (Ref. 5) conclusively proved that coarse particles could be transported in a heavy medium under laminar flow conditions but there appears to have been little work done in the literature on quantifying the required conditions to prevent deposition under these conditions. Firstly, it will be helpful to consider factors affecting deposition under zero flow conditions.
8.1 Deposition when Flow is Zero Unflocculated solid particles in a Newtonian fluid will settle if flow is stopped, unless the particles are sub-micron in size and maintained in suspension by Brownian motion. When flocculation tendencies are present, as is the case with most industrial slurries, the micron size particles may form a non-settling mixture if the concentration is greater than the critical compaction concentration (Ref. 19). This compacted fine particle slurry forms the heavy medium and has a yield stress. In his recent paper (Ref. 4) the author argued that this yield stress is capable of supporting coarse particles indefinitely under conditions of zero flow. The following equation was developed giving the yield stress required to support a particle of size .
Since that paper was submitted, an English translation of an earlier Russian book by Traynis (Ref. 20) has been published in which an identical equation was presented with the constant given as being between 0.083 to 0.10. This ability of the heavy medium to support the coarser particles means that if a turbulently flowing slurry is suddenly stopped there will be no bed of solids formed provided the yield stress is made high enough.
The suitability of equation 4 can be judged from the fact that at the lowest clay concentrations applicable to each of Figures 4 to 7 the slurries were stable if flow was suddenly stopped, although in the case of the coarse coal it was only partly stable with some of the coarsest particles settling to the bottom. Consideration of the data will show that in each case the yield stress of the clay concentration employed was greater than that required for static stability as calculated using equation 4.
8.2 Deposition under Laminar Flow Traynis (Ref. 20) has stated that provided the yield stress of the heavy medium exceeds the required to prevent settling under static conditions, given by equation 4, then laminar flow is possible. However, the data of Shook et al (Ref. 13) show that transport under laminar flow is possible with Newtonian fluids so that the criterion offered by Traynis is unsatisfactory. In
addition, remembering that at the lowest concentrations tested the slurries were stable under static conditions, it can be clearly seen from Figures 4 to 7 that considerably higher yield stresses are required for laminar flow operation than are required for static stability.
8.3 Dimensional Analysis Applied to Laminar Flow Situation Deposition of particles during laminar flow of a Bingham plastic should be a function of the following variables,
The velocity, , does not appear since it is a function of , , and .
The following dimensionless variables can be formed
If it can be assumed that and can be combined into the last two variables the result is
The last two variables of this equation are defined here as and respectively. For a Newtonian fluid ( ) and reduce to the variables employed by Shields (Ref. 21) for incipient motion of a single particle from a bed in a turbulently flowing stream. Shen and Wang (Ref. 22) used Shields' variables when studying the incipient motion of a single particle in the laminar flow case.
Implicit in the use of in place of is the assumption that the structural yield stress which supports the particles under static conditions plays no part in supporting the particles under shear conditions. Physically, this can be explained by the fact that once the shear rate reaches practical values, following the so called "avalanche breakdown" described by Traynis (Ref. 20), the floc structure is broken and so there is little resistance in the vertical direction, the particle falling. Thus, as far as motion in the vertical direction is concerned, the particle is envisaged as being in a Newtonian fluid of viscosity equal to the plastic velocity.
Figure 9 is a plot of and at deposition for the data of Figures 4 to 7 plus other data obtained by the author, data by Kenchington (Ref. 2) with clay suspensions and also data obtained by Shook et al (Ref. 13) with viscous Newtonian fluid suspensions. The relevant data are given in Table 2. The data points for any one concentration, e.g. 18%, appear to roughly indicate an inverse relationship between and although scatter is very large. Most of this scatter is due to the fine sand and fine coal results where is only slightly greater than with the consequent large errors in the term which appears in both and . If the four data points pertaining to these are removed the correlation for the 18% concentration is seen to be quite satisfactory. Consideration of the values in Table 2, which range from 13 to 350 suggests that the ratio can safely be excluded from the functional relationship given in equation 7. The other variable in equation 7 is the concentration and from the limited data available Figure 9 indicates this is of importance with the critical value of decreasing with increasing concentration.
9. PRACTICAL SIGNIFICANCE OF DEPOSITION CRITERION
Figure 9 indicates an approximate inverse relationship between and . A similar relationship was indicated by Shields (Ref. 21) for the low Reynolds' number region where particles were small enough to be within the viscous sub-layer and viscous forces predominate. The approximate inverse relationship between and indicated by Figure 9 means that for a particular slurry deposition in different pipe sizes will occur at a constant value of wall shear stress. This is confirmed by the data of Kenchington (Ref. 2) where deposition occurred at ( ) in the 13 mm pipe and at (11.0 Pa) in the 25 mm pipe. This means that as the
pipe size is increased the deposition velocity will increase approximately in direct proportion so that after even a moderate increase in pipe size laminar flow will no longer be possible because of transition to turbulence as is indicated by Kenchington's results for the 51 mm pipe. This is very significant in relation to the dense phase transport concept of Elliott & Glidden (Ref. 5) since it means that for laminar flow to be possible at any one typical velocity the concentration of the slurry (and hence of the heavy medium portion) will need to be increased as the pipe size is increased. In other words, the fact that laminar flow is possible in a pilot scale pipe does not necessarily mean that the same slurry can flow under laminar flow in a full scale pipeline. This was illustrated by tests performed by the author (Ref. 23) on a loam slurry (sand and clay in approximate ratio of 5 to 1). In the 18.9 mm pipe loop laminar flow was possible down to zero velocity at concentrations above 27.5%. However, in the 105 mm pipe loop a concentration of 35% was required before laminar flow was possible. For stability under static conditions a concentration of 23.5% was required.
10. CONCLUSIONS
Pressure gradient reduction in flow of slurries comprising coarse particles in heavy media suspensions has been experimentally verified by pipe loop tests under pseudo-homogeneous turbulent flow conditions. However, practical application of the effect may be limited because of the high velocities required although further work is required before its usefulness can be accurately gauged.
Data for deposition under laminar flow of both Newtonian and non-Newtonian heavy media can be correlated using modified Shields' parameters as suggested by a dimensional analysis. This result is significant to the so called "dense phase transport" concept, indicating that for laminar flow to be possible the concentration of the slurry could be increased as the pipe size is increased.
11. ACKNOWLEDGEMENTS
The author thanks M.D. Research Co. Pty. Ltd. for permission to publish this paper.
12. REFERENCES
- 1. DURAND, R. : "Basic relationships of the transportation of solids in pipes - experimental research." Proc. 5th Minneapolis Int. Hydr. Conv., pp. 89-103. Int. Assoc. for Hydr. Res. (1953).
- 2. KENCHINGTON, J.M. : "Prediction of critical conditions for pipeline flow of settling particles in a heavy medium". Proc. 4th Int. Conf. on the Hydr. Transport of solids in Pipes, Paper D3. Organised by Brit. Hydromech. Res. Assoc., Cranfield (18th-21st May, 1976).
- 3. WASP, E.J., AUDE, T.C. SEITER, R.H. and THOMPSON, T.L. : "Heterogeneous solids/liquid flow in turbulent regime." "Advances in Solid-Liquid Flow in Pipes and its Application", edited by I. Zandi, Pergamon (1971).
- 4. THOMAS, A.D. : "A rational design philosophy for long distance slurry pipelines" Chemical Engineering in Australia, the Trans. of the College of Chem. Engineers. (1977).
- 5. ELLIOT, D.E. and GLIDDEN, B.J. : "Hydraulic transport of coal at high concentrations", Proc. 1st Int. Conf. on the Hydraulic Transport of Solids in Pipes, Paper G2. Organised by Brit. Hydromech. Res. Assoc., Cranfield (1st - 4th Sept. 1970).
- 6. CHARLES, M.E. and CHARLES, R.A. : "The use of heavy media in the pipeline transport of particulate solids", "Advances in Solid-Liquid Flow in Pipes and its Application", edited by I. Zandi, Pergamon (1971).
- 7. VOCADLO, J.J., and CHARLES, M.E. : "Prediction of pressure gradient for the horizontal turbulent flow of slurries". Proc. 2nd Int. Conf. on the Hydr. Transport of Solids in Pipe, paper C1. Organised by Brit. Hydromech. Research Assoc., Cranfield. (20th-22nd Sept., 1972).
- 8. THOMAS, A.D. : "Particle size effects in turbulent pipe flow of solid-liquid suspensions". Proc. 6th Australasian Hydr. and Fluid Mechanics Conf., Adelaide. Organised by Inst. of Engineers, Aust. (5th-9th Dec., 1977).
- 9. MAUDE, A.D. and WHITMORE, R.L. : "The turbulent flow of suspensions in tubes", Trans.
Inst. Chem. Engrs, Vol. 36, pp. 296-304. (1958)
10. DAILY, W.D. and ROBERTS, P.R. : "Rigid particle suspensions in turbulent shear flow, Tappi, Vol. 49, n 3, pp. 115-125 (1969).
11. THOMAS D.G. : "Transport characteristics of suspension, Pt. VI, Minimum transport velocity for large particle size suspensions in round horizontal pipes" A.I.Ch.E. Journal, Vol. 8, n 3, pp. 373-378 (July, 1962).
12. WASP, E.J., AUDE, T.C., KENNY, J.P., SEITER, R.H. and JACQUES, R.B. : "Deposition velocities, transition velocities, and spatial distribution of solids in slurry pipelines" Proc. 1st Int. Conf. on the Hydr. Transport of Solids in Pipes, paper H4, Organised by Brit. Hydromech. Res. Assoc., Cranfield, (1st - 4th Sept., 1970).
13. SHOOK, C.A., SCHRIEK, W., SMITH, L.G., HAAS, D.B. and HUSBAND, W.H.W. : "Experimental studies on the transport of sand in liquids of varying properties in 2 and 4 inch pipelines", Saskatchewan Research Council, Canada, Report E73-20. (1973).
14. THOMAS, D.G. : "Transport characteristic of suspensions: Pt. IV. Friction loss of concentrated - flocculated suspensions in turbulent flow, A.I.Ch.E. Jnl, Vol. 8, n 2, pp 266-271 (1962).
15. THOMAS, A.D. : "Description of slurry test loop". Unpublished report TN-13, M.D. Research Co. Pty. Ltd.
16. VOCADLO, J.J. : "Role of some parameters and effective variables in turbulent slurry flow". 4th Int. Conf. on the Hydr. Transport of Solids in Pipes, paper D4. Organised by Brit. Hydromech. Res. Assoc. Cranfield. (18th - 21st May, 1976).
17. TUFT, P.R.B. : Unpublished data at M.D. Research Co. Pty. Ltd. (1977).
18. KENCHINGTON, J.M. : "An assessment of methods of pressure drop prediction for slurry transport" 3rd Int. Conf. on Hydr. Transport of Solids in Pipes, paper F1, Organised by Brit. Hydromech. Res. Assoc., Cranfield. (15th - 17th May, 1974).
19. THOMAS, D.G. : "Hydromech. Res. Assoc., Cranfield. (15th - 17th May, 1974).
20. TRAYNIS, V.V. : "Transport characteristics to rheological parameters" A.I.Ch.E. Jnl, Vol 9 n3, pp. 310-316 (1963).
21. TRAYNIS, V.V. : "Parameters and flow regimes for hydraulic transport of coal by pipelines" Terraspace Inc., Rockville, Md, U.S.A. (1977). Translation from Russian of the book, Parametry I Rezhimy Gidravlicheskogo Transportirovaniya Uglya Po Truboprovodam, Izdatelstvo Nauko, (1970).
22. SHIELDS, A. : "Application of Mechanical similarity and turbulence studies of sediment motion". "Anwendung der Ahnlichkeits - Mechanik und der Turbulenzforschung auf die Geschiebebewegung, Preussische Versuchsanstalt fur Wasserbau und Schiffbau". Berlin, (1936).
23. SHEN, H.W. AND WANG, J.S. : "Incipient motion and limiting deposit conditions of solid-liquid pipe flow". Proc. 1st Int. Conf. on the Hydr. Transport of Solids in Pipes, paper H3. Organised by Brit. Hydromech. Res. Assoc., Cranfield. (1st - 4th Sept. 1970).
24. THOMAS, A.D. : Unpublished data at M.D. Research Co. Pty. Ltd. (1977).
TABLE 1
18.9 mm PIPE LOOP TESTS WITH TWO SANDS IN CLAY SUSPENSIONS
S.G. Clay 2.29, S.G. Sand 2.65
| Clay properties: | Concentration | Fine Sand Tests | Coarse Sand Tests |
|---|---|---|---|
| Density |
9.85%
1130 kg m -3 |
12.2%
1160 kg m -3 |
|
| 3.7 Pa | 7.0 Pa | ||
| 0.0059 Nsm -2 | 0.0066 Nsm -2 | ||
| Concentration of sand in clay = | 23.5% | 18.1% | |
| Resulting overall density = | 1480 kg m -3 | 1430 kg m -3 |
TABLE 2
RELEVANT QUANTITIES AT CONDITION OF DEPOSITION
UNDER LAMINAR FLOW
| Slurry | C | D | d max | D d | C m | τ m | τ om | η m | ο m | N B | Re * B | Reference | |
|---|---|---|---|---|---|---|---|---|---|---|---|---|---|
| % | mm | % | Pa | Pa | Nsm -2 | Kgm -3 | |||||||
| 0.49 | Clay + Fine Sand | 16.8 | 105 | .3 | 350 | 5.25 | 3.35 | 2.6 | .0039 | 1070 | .16 | 2.2 | Fig. 4 |
| 1.06 | Clay + Fine Sand | 16.8 | 105 | .3 | 350 | 6.23 | 5.00 | 4.2 | .0045 | 1085 | .17 | 2.0 | Fig. 4 |
| 0.40 | Clay + Coarse Sand | 18.5 | 105 | 1.5 | 70 | 7.40 | 9.1 | 6.6 | .0053 | 1100 | .11 | 15 | Fig. 5 |
| 2.1 | Clay + Fine Coal | 19.9 | 105 | 1.0 | 105 | 6.03 | 4.8 | 4.0 | .0043 | 1080 | .35 | 6.8 | Fig. 6 |
| 2.66 | Clay + Fine Coal | 19.9 | 105 | 1.0 | 105 | 6.68 | 5.7 | 5.1 | .0048 | 1090 | .28 | 5.3 | Fig. 6 |
| 0.16 | Clay + Coarse Coal | 21.2 | 105 | 8.0 | 13 | 4.76 | 3.05 | 2.2 | .0034 | 1065 | .044 | 71 | Fig. 7 |
| 0.26 | Clay + Coarse Coal | 21.2 | 105 | 8.0 | 13 | 6.05 | 4.65 | 4.0 | .0043 | 1080 | .036 | 49 | Fig. 7 |
| 0.15 | Loam | 18 | 18.9 | .82 | 23 | 5.20 | 1.9 | .66 | .0026 | 1070 | .098 | 11.5 | Ref. 23 |
| 0.23 | Loam | 26 | 105 | .82 | 128 | 8.0 | 2.9 | 2.0 | .0042 | 1100 | .072 | 6.1 | Ref. 23 |
| 30/50 mesh sand in ethylene glycol } | 18 | 52 | .59 | 88 | - | 6.0 | 0 | .0382 | 1132 | .68 | 1.27 | Ref. 13 | |
| 60/100 mesh sand in ethylene glycol " } | 24 | 52 | .59 | 88 | - | 3.2 | 0 | .0382 | 1132 | .36 | .93 | Ref. 13 | |
| 5 | 52 | .25 | 210 | - | 6.27 | 0 | .0382 | 1132 | 1.68 | .55 | Ref. 13 | ||
| 18 | 52 | .25 | 210 | - | 5.1 | 0 | .0382 | 1132 | 1.37 | .50 | Ref. 13 | ||
| 30 | 52 | .25 | 210 | - | 2.9 | 0 | .0382 | 1132 | .77 | .37 | Ref. 13 | ||
| Clay + Coarse Sand " } | 4.0 | 13 | 1.0 | 13 | 16.4 | 10.1 | 4.79 | .0116 | 1394 | .43 | 7.4 | Ref. 2 | |
| 6.2 | 25 | 1.0 | 25 | 16.4 | 11.0 | 4.79 | .0116 | 1394 | .50 | 8.0 | Ref. 2 |
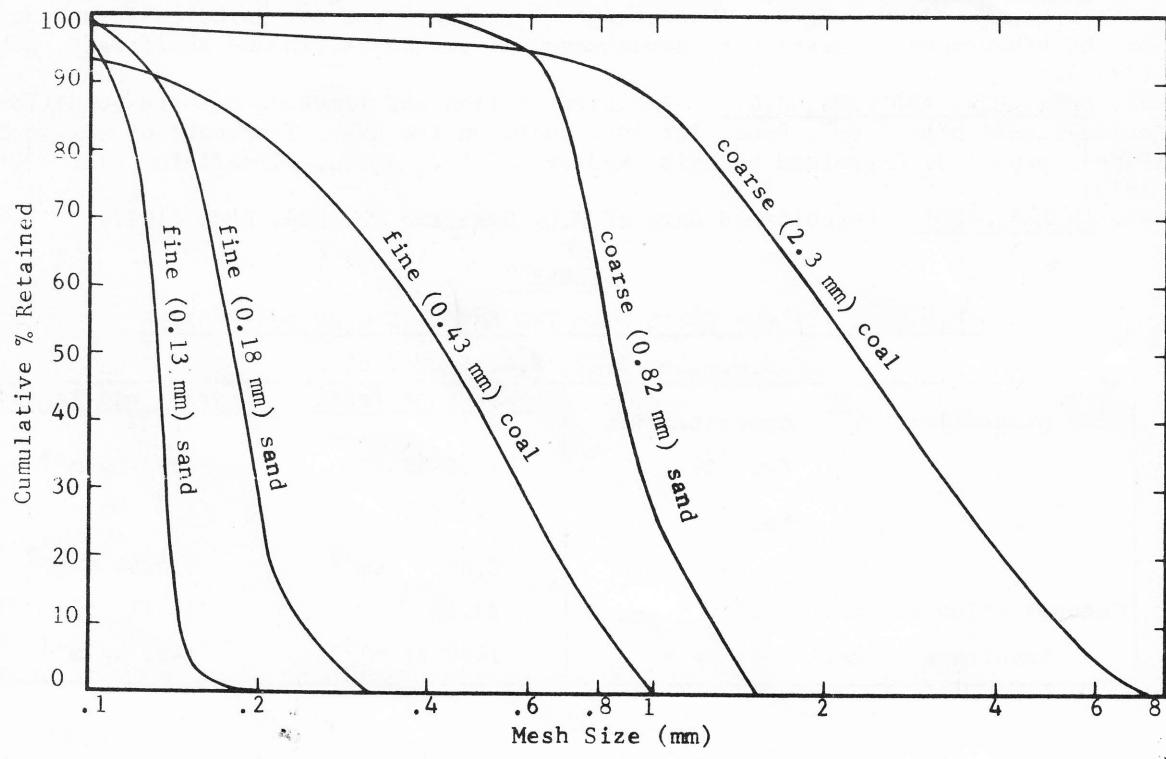
Fig. 1 Particle size distributions
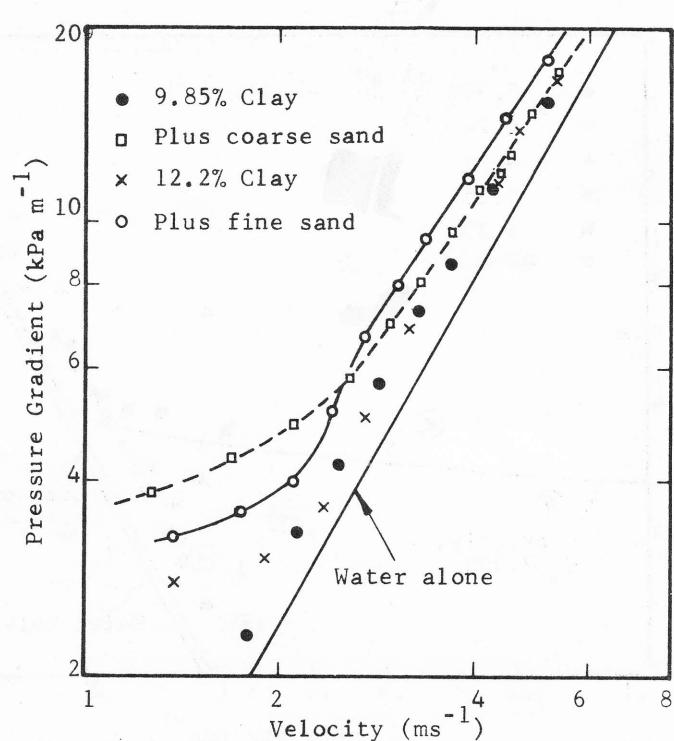
Fig. 2 18.9 mm pipeloop results
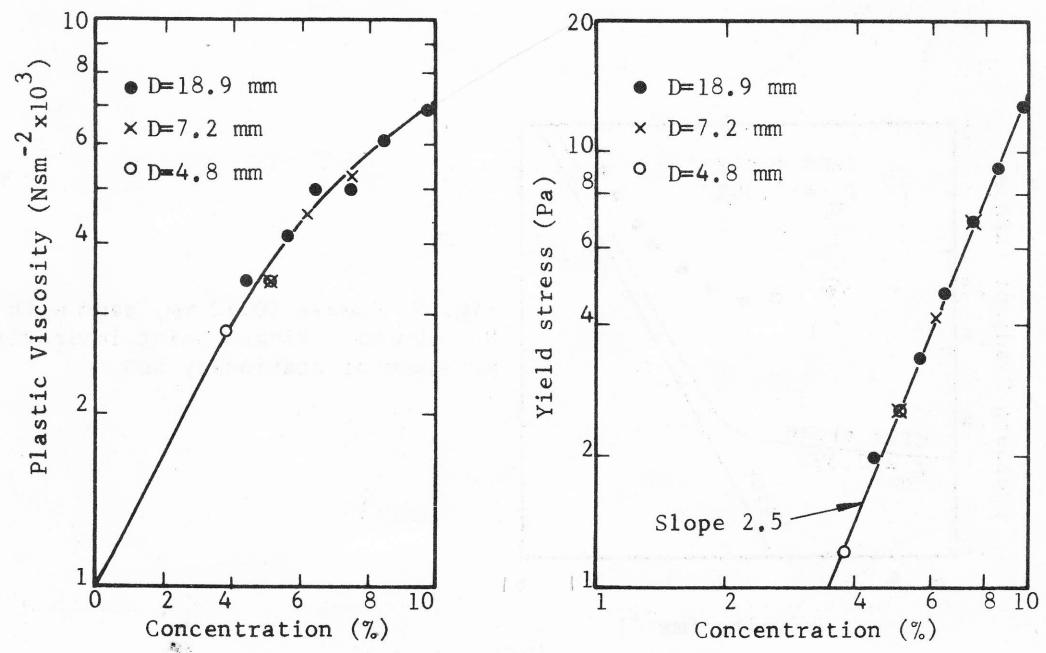
Fig. 3 Bingham parameters of clay used in 105 mm pipeloop tests.
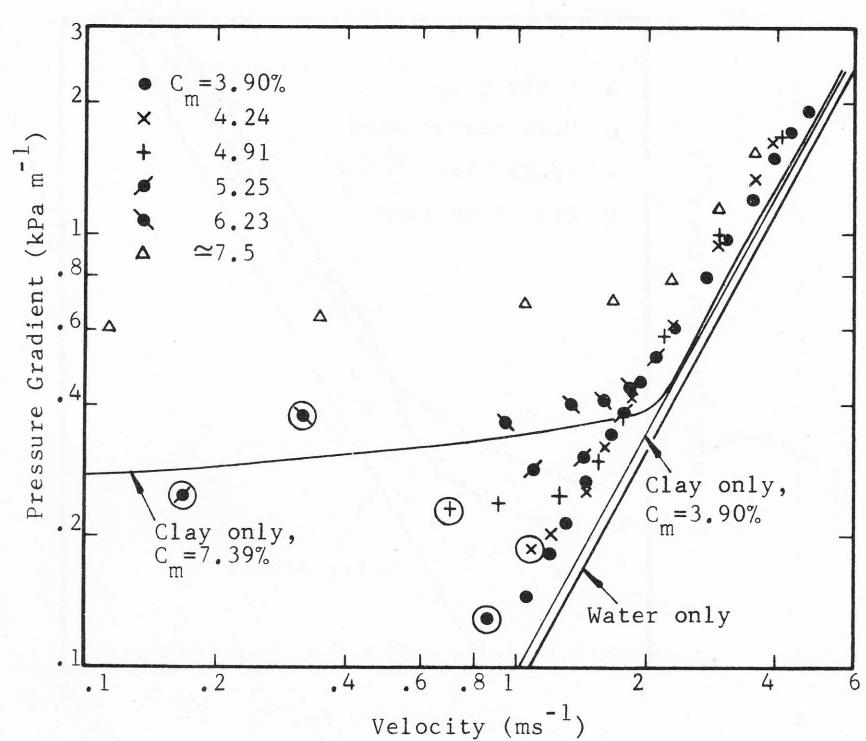
Fig. 4 Fine (0.18 mm) sand with clay, mm. Ringed points indicate presence of stationary bed.
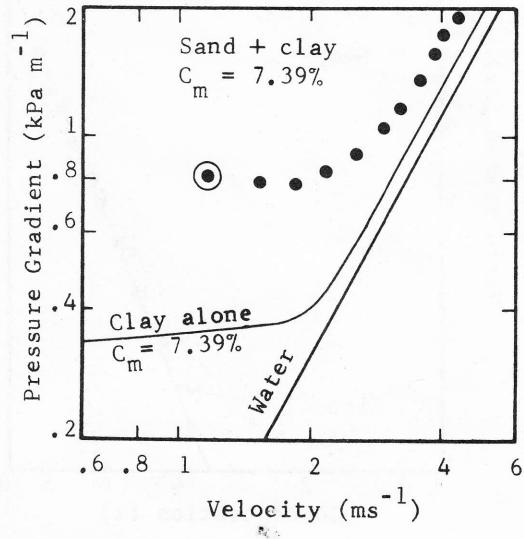
Fig. 5 Coarse (0.82 mm) sand with clay, mm. Ringed point indicates presence of stationary bed.
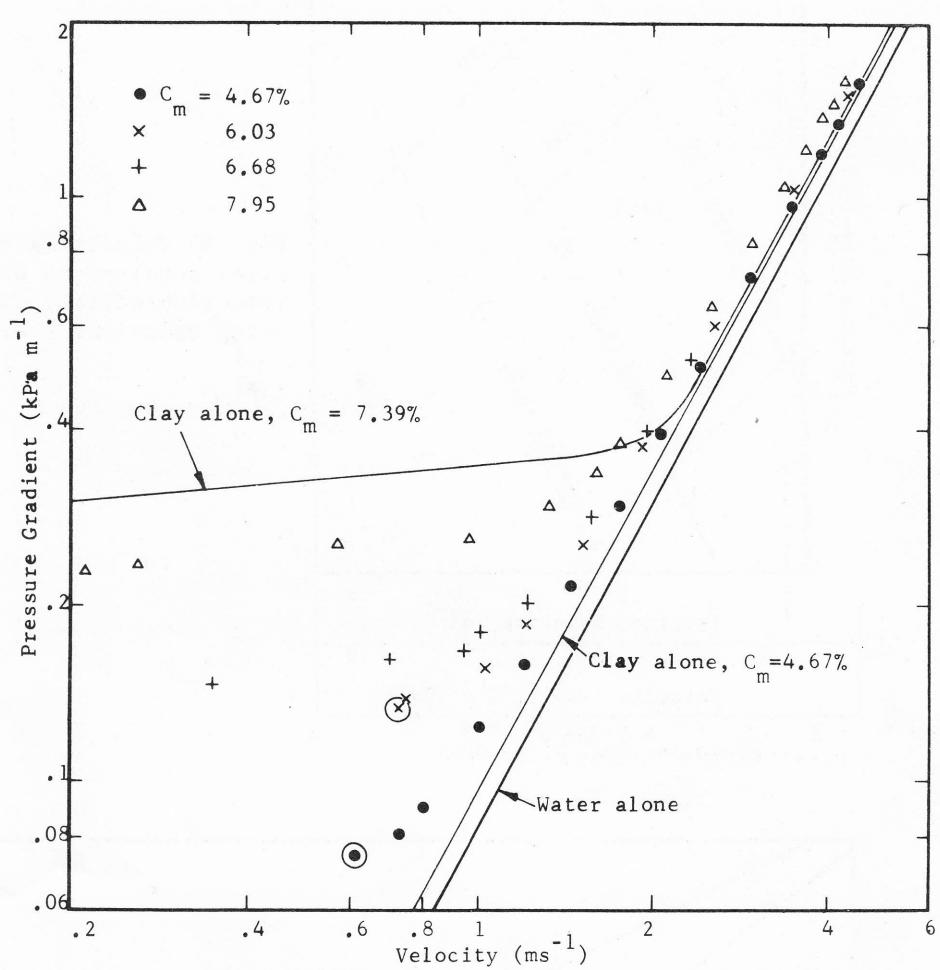
Fig. 6 Fine coal with clay, mm. Ringed points indicate stationary bed.
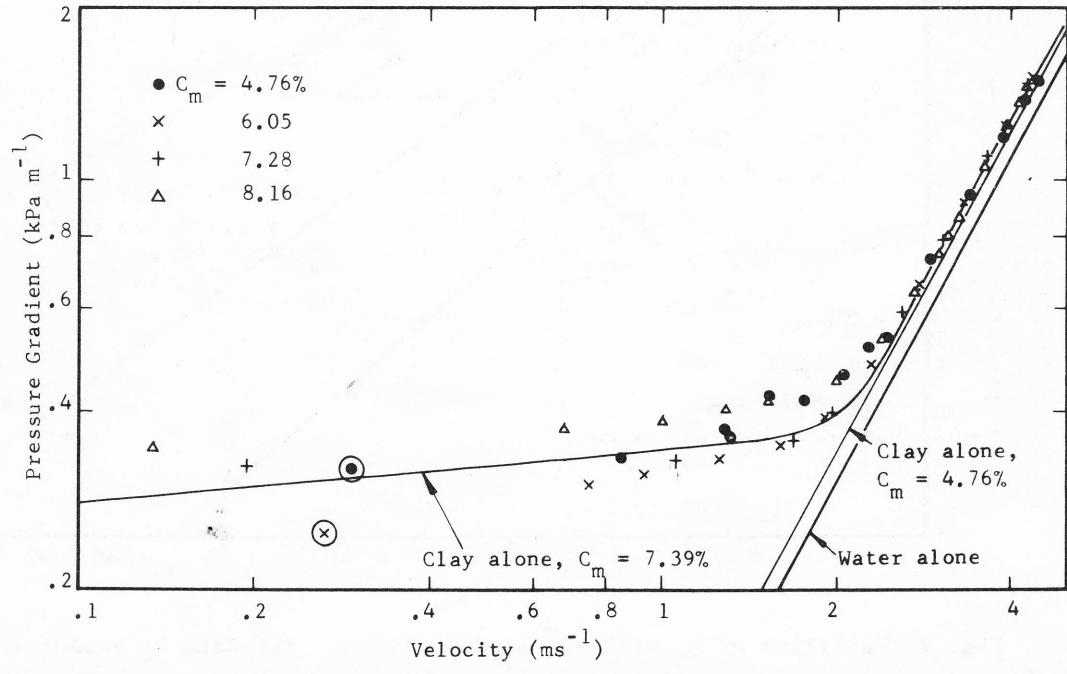
Fig. 7 Coarse coal with clay, mm. Ringed points indicate stationary bed
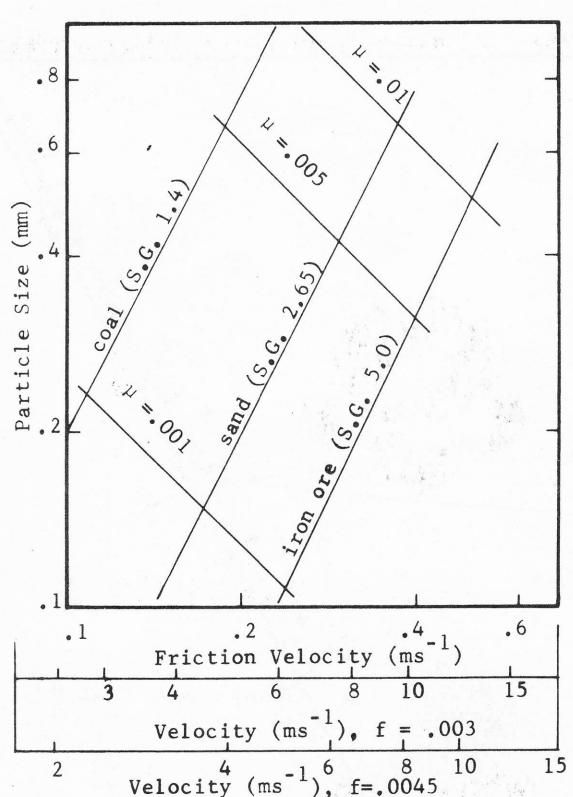
Fig. 8 Velocities and particle sizes required to obtain pressure reduction effect, calculated using equations 2 and 3.
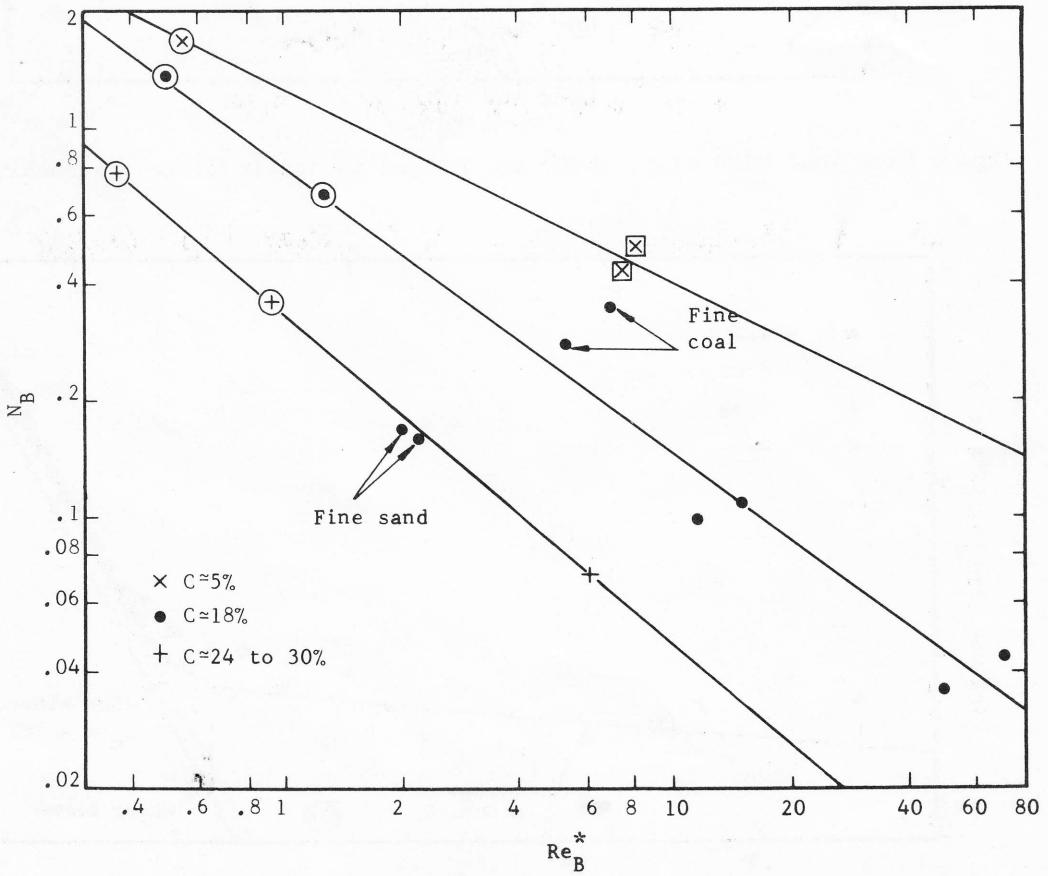
Fig. 9 Variation of with at deposition. All data by author except those marked ○ (Ref. 13) and □ (Ref. 2).