This HTML edition contains selectable text extracted from the original PDF. Layout-aware OCR was used to recover reading order, figures and equations; minor recognition errors may remain. Consult the PDF for the authoritative layout, figures and equations.
Settling of Particles in a Horizontally Sheared Bingham Plastic
A.D. THOMAS
M.D. Research Company Pty. Ltd., North Ryde, N.S.W., 2113
1. INTRODUCTION
There is an increasing interest in the pipeline transport of "stabilized" slurries consisting of coarse particles suspended in a flocculated fine particle carrier fluid or "vehicle", (1,2). This concept is particularly relevant to the Australian coal industry where it holds possess a yield stress and can loosely be considered as Bingham plastics. Under static conditions the yield stress of the vehicle supports a most coarse particles (3) and prevents them settling to the bottom, hence the term "stabilized". This is a the desirable property and it means that such slurry pipelines can be easily re-started even after extended periods of shutdown. The high yield stress required to ensure stability of such coarse particles means that, at the normal pumping velocities of 1 to 2 ms -1 , these slurries will flow under laminar conditions. Hence the flow of such slurries can be analysed as the laminar flow of a Bingham plastic containing coarse particles of size such that they do not settle under static conditions but may settle under shearing.
There have been a number of investigations into the settling of particles in stationary Bingham plastics (e.g. 4,5,6) or the drag of stationary particles in moving Bingham plastics (7,8). Neither of these two situations are directly relevant since the present concern is with particles which do not settle in stationary Bingham plastics and which, in a flowing pipe, are moving at nearly the same horizontal velocity as the fluid.
2. CONDITIONS IN A FLOWING BINGHAM PLASTIC
When a true Bingham plastic flows in a pipe at low flow rates there exists a sheared region near the wall together with an unsheared plug in the centre where the shear stress, , is less than the Bingham yield stress, . Since the true yield stress is generally less than the plug will be smaller than the Bingham model suggests but some unsheared region will still presumably exist. In this region the floc structure is undisturbed and so it would be expected there that particles which were stable under static conditions would also be stable under flow conditions. In contrast, particles in the sheared region near the wall would be surrounded by a broken floc structure and so would settle. This paper is concerned with quantifying this settling rate in the sheared region (e.g. Stokes' law), to find a representative viscosity which, if used in the appropriate equation (e.g. Stokes' law), will quantify the settling rate. Since the particles are falling transverse to the main direction of shearing the problem is, in effect, to find a representative "transverse" viscosity, .
Intuitively could perhaps be expected to equal the effective viscosity in the direction of primary shear, , given by
However another possibility is that is equal to the incremental viscosity in the direction of primary shear, , given by
This is feasible on the basis that the floc structure is already broken to some degree by the primary shear so the relevant viscosity resisting the particle movement is only the incremental viscosity.
3. PARTICLE SETTLING TESTS IN A ROTATIONAL VISCOMETER
3.1 Instrumentation & Procedure
The settling of particles in the annulus of a cylindrical viscometer whose axis is vertical, involves settling transverse to the main direction of shearing and so is analogous to the pipe flow situation. It represents a convenient way of studying this phenomenon and so a suitable viscometer was built out of clear perspex having a cup diameter of 146 mm, a bob diameter of 114 mm and a length of 235 mm. The annulus gap width of 16 mm was a compromise between the requirements for a viscometer of a preferably narrow gap and the need to minimize wall effects during settling of reasonably sized particles.
A recess in the lower end of the rotating bob meant that an air pocket formed thereby ensuring that the contribution to torque of the lower end was negligible. The torque was measured by a spring dynamometer on the drive shaft.
The particles chosen were glass spheres of nominal diameters 5.0 and 2.5 mm of density 2500 kg m -3 and steel spheres of diameter 3.175 mm. During settling tests with Bingham plastic suspensions particles settling in the annulus were not visible. To overcome this a flexible plastic truncated cone could be fitted to the bottom of the rotating inner cylinder. Particles released in the annulus would fall, without being visible, until they reached the cone where they would be swiftly swept out to the outer wall and become visible. The 2 mm gap between the outer edge of the cone and the outer wall prevented the particles falling any further and ensured that they contacted the outer wall. Having noted the time taken, the rotation could be stopped and the particle pushed down past the flexible cone using a rod to fall to the bottom of the viscometer. The annulus and cone area was then free of particles and ready for the next test. When torque measurements were taken the cone was removed.
3.2 Calibration with Newtonian Fluids
Experiments were first conducted with a Newtonian fluid (glycerol) to determine the influence of the walls and the relatively short axial length of the viscometer on particle settling velocities both in the middle of the annulus and viscosities both with and without rotation. The influence of the bottom cone was also studied. Fluid at the wall between 0.6 and 0.8 Nsm -2 were used as these resulted in similar settling rates as in the chosen Bingham plastic. The conclusions were as follows: With zero rotation the particle settling rates for 5 mm and 2.5 mm glass spheres in the middle of the annulus were respectively 90% and 95% of the unhindered value obtained in a 1.5 m high 75 mm diameter settling cylinder. Particles released touching the wall stayed in contact with the wall during their descent available. Particles were released touching the wall stayed in contact with the wall during their height and resulted in settling velocities respectively 50% and 43% of the unhindered value. Rotation of the inner cylinder at speeds up to the maximum used in the Bingham plastic tests (140 RPM) produced no detectable effect on the settling rates. The presence of the cone was found to cause negligible effect and it was also observed that the time taken for particles to be swept out after reaching the cone was negligible compared with the descent time.
3.3 Rheology of Bingham Plastic Suspension
The experiments were conducted with a China Clay, "Eckalite 2", marketed by Kaolin Industries Ltd, Pittong, Victoria. Two concentrations were tested, 7.9% and 11.0% by volume, the resulting densities of the suspensions being 1110 and 1150 kg m -3 . In all reported tests the spheres were stable under static conditions in the relevant suspensions. The rheological properties were able to be determined in four different ways; from tests in 9.41 mm and 105 mm horizontal pipe loops, with the rotational viscometer just described, and with a Brookfield rotational viscometer. The results for 7.9% concentration are shown in Figure 1 plotted as shear stress, , versus true shear rate, . It can be seen that the data for shear rates above 1000 sec -1 fit a Bingham model with a yield stress of 10.5 Pa and a plastic viscosity of NSm -2 . A similar plot for the 11.0% concentration indicated a yield stress of 25.4 Pa and a plastic viscosity of NSm -2 . At shear rates below 1000 sec -1 the data are seen to fall away from the Bingham line.
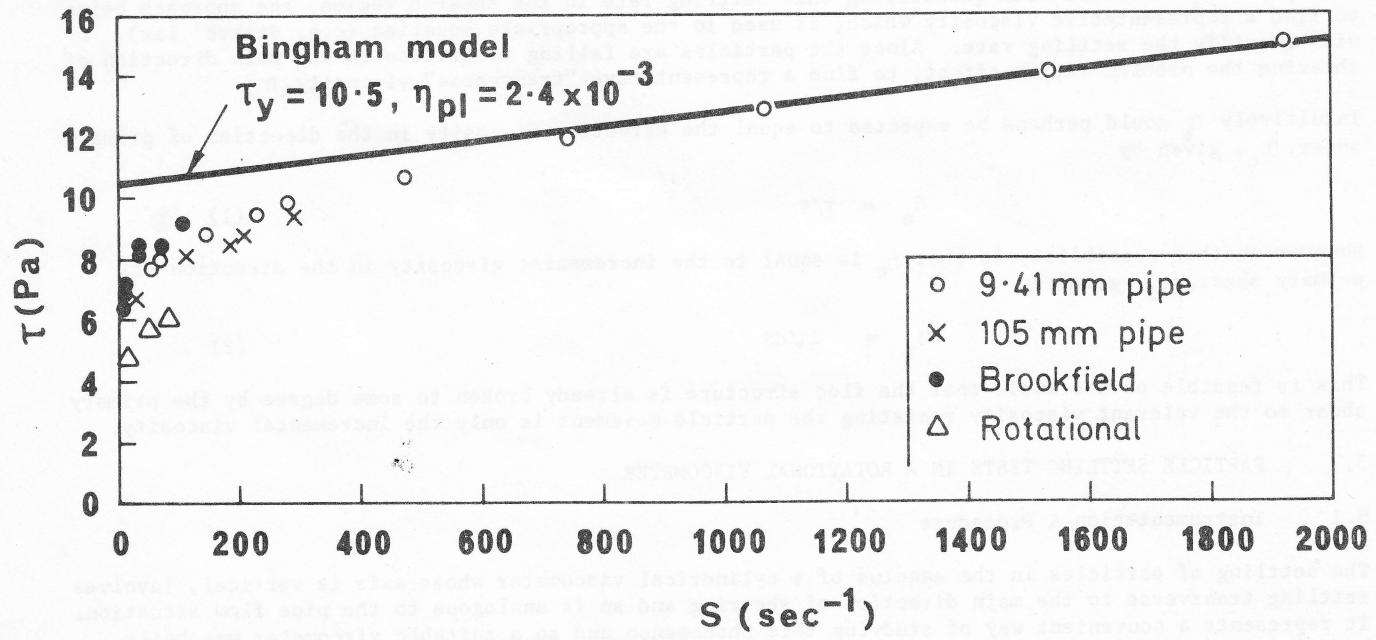
Figure 1 : Rheology of clay suspension at 7.9% concentration obtained in various instruments.
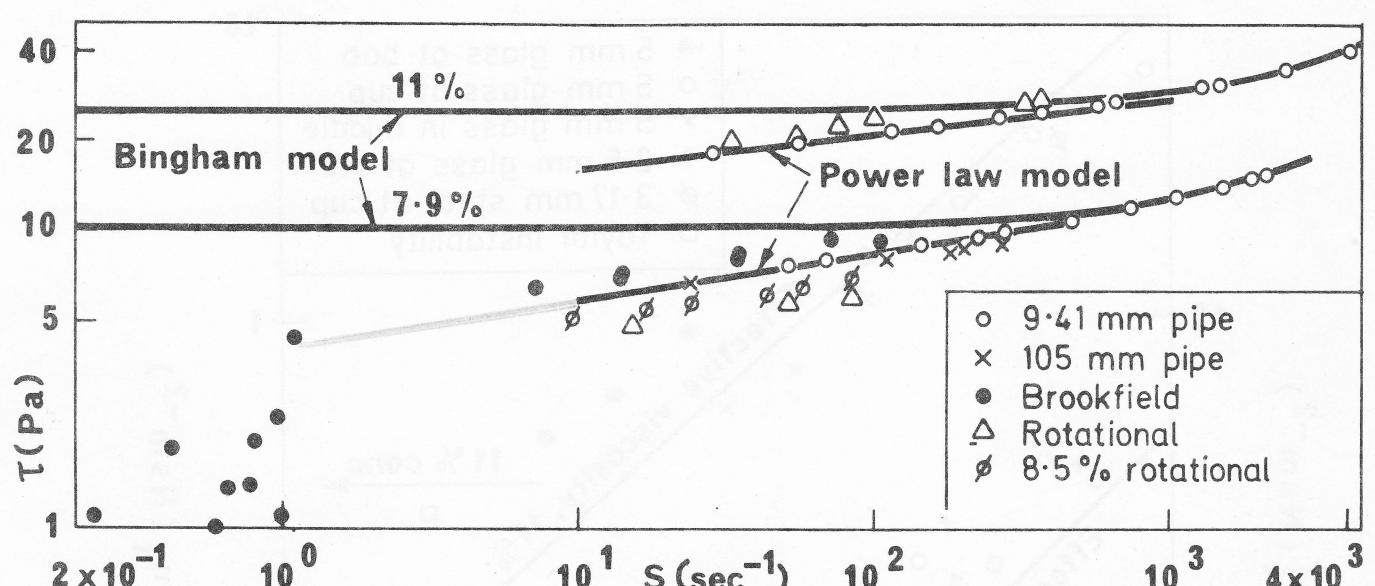
Figure 2 : Logarithmic plots of rheological data at 7.9 and 11.0% concentrations.
Figure 2 shows the results for both concentrations plotted on log-log co-ordinates. It can be seen that in the range the data closely follow the power law model with slopes of 0.15 and 0.125 for the 7.9 and 11% concentrations respectively. There are considerable differences between the results from the different instruments but the variation of with is similar in all cases. The 9.41 mm pipe loop results are considered the most accurate and the power law model fitted to this data results in co-efficients of 4.1 and 12.0 for the 7.9 and 11% concentrations respectively.
Behaviour such as this is typical of flocculated suspensions as noted by D.G. Thomas (9) and shows why the term Bingham plastic can of be used loosely with regard to these materials. At shear rates below the shear stress falls off rapidly with greatly increased scatter. For 7.9% concentration the static yield stress measured using the Brookfield viscometer lay between 1 and 2.5 Pa depending on the bob size and the initial speed of rotation.
The shear rates in the rotational viscometer settling tests ranged from to so the power law model is most relevant. Using this model and knowing the geometry of the viscometer and the speed of rotation the shear rates at any position across the annulus were calculated using the method outlined by Skelland (10). The shear rate varied considerably across the annulus the value at the cup being about 1/25th of the value at the bob. As mentioned previously spheres were released at three positions across the annulus; at the bob and cup walls and in the middle. The relevant shear rate was assumed to be that existing at the radial position of the centre of the sphere. Thus for 5 mm spheres the shear rate for particles falling in contact with the cup wall was calculated for a radius of 73 - 2.5 = 70.5 mm and so on.
3.4 Discussion of Results
The measured settling velocities in the clay suspensions were adjusted by the factors given in section 3.2, the assumption being that the wall and other effects would be similar to that observed with Newtonian fluids. These adjusted values were then fed into Stokes' equation and the effective transverse viscosity, , calculated. The results are shown in Figure 3 plotted as versus shear rate, the latter values being calculated for the radial position of the centre of the spheres as explained in the previous section. Also shown on this plot is the variation of the effective viscosity, , with shear rate.
A large amount of scatter is evident. The two major reasons are likely to be firstly the uncertainty as to the true radial position of the spheres during settling in the opaque suspensions and secondly the possibility that corrections for gap and wall effects are not the same as in a Newtonian fluid. The radial position of the spheres is known accurately only for these released at the cup in which case they clung to the wall and were visible during descent. For spheres released near the bob and in the centre of the annulus their radial position can only be assumed. Even slight errors in radial position will cause large scatter on Figure 3 because the shear rate varies so markedly across the annulus. Unfortunately for those spheres whose radial position is known accurately (those at the cup) the correction for wall effects is largest meaning that any deviation from the Newtonian fluid value will cause a correspondingly large error in the calculated value of .
In spite of these problems it would seem that the transverse viscosity is much closer to than to , which for the 7.9 and 11% concentrations, is respectively 0.15 and 0.125 of . Whether is in fact equal to , with the discrepancy between the two on Figure 3 being due to experimental errors, or whether it is different but of the same order is unknown at present. The results for the 7.9% concentration seem to indicate whereas the results for 11% could be interpreted as indicating . The possibility of a difference between the two is reinforced by the observed onset of rotational instability indicated by the squares on Figure 3. These were obtained as follows:
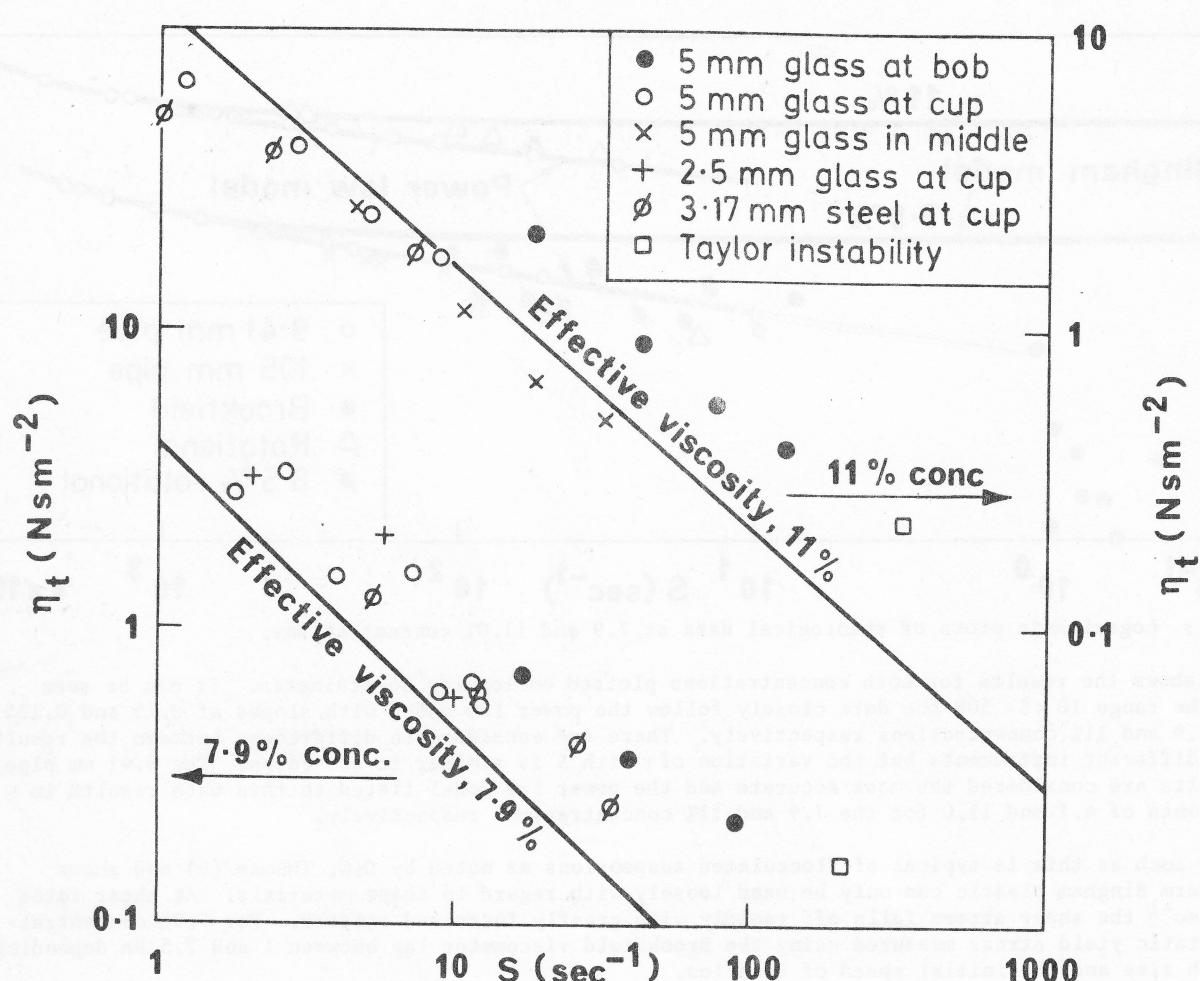
Figure 3: Transverse viscosities calculated from settling rates of spheres in rotational viscometer.
Viscometers such as this, having an inner rotating cylinder, are limited in their range of operating speeds by Taylor instabilities which occur above a certain speed. All of the settling tests were performed at speeds below this critical speed which was observed to be somewhere between 130 and 147 RPM for the 7.9% suspension and between 175 and 195 RPM for the 11% suspension. The theoretical prediction of the critical Taylor speed for Newtonian fluids is fairly well advanced with perhaps the result of Roberts (11) being the most accurate. Using his results an effective viscosity can be calculated for the present geometry. Such instabilities are known to start at the surface of the inner cylinder so the appropriate shear rate is that existing at the bob. The results are shown plotted on Figure 3 the size of the squares representing the upper and lower limits of RPM. The resistance to centrifugal instability could be expected to depend on the transverse viscosity so it is reasonable to compare these results with the settling sphere results. For both concentrations they lie above the effective viscosity. Moreover, as noted above, the ratio for the stability results is greater at the lower concentration.
It is of interest to note the findings of Higgate and Whorlow (12) who conducted similar settling sphere experiments as these in a visco-elastic fluid. They found that the transverse viscosity was greater than both the effective primary viscosity and the incremental primary viscosity with ranging from about 1.8 to 3.2 times depending on the shear rate.
Resolution of this problem will require more accurate experiments and possibly a more detailed analysis than presented here. In the interim it can tentatively be concluded that is of the same order as and that is not appropriate.
REFERENCES
- 1. PERTUIT, P., TENNANT, J.D., LAWLER, H.L. and COWPER, N.T. Proc. 3rd Int. Tech. Conf. on Slurry Transportation , Las Vegas, 1978.
- 2. THOMAS, A.D. Proc. 4th Int. Tech. Conf. on Slurry Transportation , Las Vegas, March, 1979.
- 3. THOMAS, A.D. Chem. Engng. in Aust. 2, 22 (1977).
- 4. VALENTIK, L. and WHITMORE, R.L. Brit. Jnl. Appl. Phys. 16, p 1197 (1965).
- 5. ANSLEY, R.W. and SMITH, T.N. A.I. Ch. E. Jnl. 13(6), p 1193 (1967).
- 6. ITO, S. and KAJIUCHI, T., Jnl. of Chem. Engng of Japan , 2(1), p 19 (1969).
- 7. BROOKS, G.F. and WHITMORE, R.L., Rheol. Acta , 8(4), p 472 (1969).
- 8. PAZWASH, H. and ROBERTSON, J.M., Jnl. of Hydr. Res. , 13(1), p 35 (1973).
- 9. THOMAS, D.G. Industrial & Engng Chem. , 55(11), p 18 (1963).
- 10. SKELLAND, A.H.P. Non-Newtonian Flow & Heat Transfer , Wiley, 1967.
- 11. ROBERTS, P.H. Proc. Roy. Soc. , 4283, p 550 (1965).
- 12. HIGGATE, D.J. and WHORLOW, R.W., Brit. Jnl. Appl. Phys. 18, p 1019 (1967).