This HTML edition contains selectable text extracted from the original PDF. Layout-aware OCR was used to recover reading order, figures and equations; minor recognition errors may remain. Consult the PDF for the authoritative layout, figures and equations.
4th National Congress
on Rheology,
McLaide, S.A.
June 3-5
1986
BY A.D. THOMAS AND N.T. COWPER
Slurry Systems Pty Ltd, Sydney
1. Introduction
A major consideration in slurry pipeline design is pipe wear rate. Many factors influence pipe wear among them flow velocity, particle size, solids concentration and particle hardness. One additional factor which has received almost no attention in the literature is slurry rheology. The present paper discusses the likely role of rheology in general terms. Some preliminary results from tests in a wheelstand test rig are also presented.
2. Typical Rheology
The rheology of mineral slurries can generally be analysed in terms of the Bingham plastic model. Under laminar flow conditions both the yield stress and the plastic viscosity are of importance. However, the majority of slurry pipelines operate in turbulent flow. In this case, the yield stress is of less importance and for present purposes the plastic viscosity will be assumed to dictate the behaviour.
For economic reasons, the operating velocity is never less than about 1m/s. To maintain turbulent flow at this velocity the yield stress of typical long distance type slurries is generally in the range 1 to 4Pa. Typical plastic viscosities are in the range 10 to 30mPas.
If the particles are fine enough, e.g. colloidal in size, they will be homogeneously distributed throughout the pipe. Particles
larger than this will behave heterogeneously with some of the particles supported by the turbulent eddies and others moving as a saltating or sliding bed (contact load) along the bottom of the pipe. Once the particle size exceeds about 0.5mm nearly all of the particles will travel as contact load. The relative proportions travelling homogeneously and as contact load are given as an exponential function of the ratio (Wilson and Judge, 1978, Wasp et al, 1963) where is the particle terminal settling velocity and is the friction velocity ( ). is the velocity and is the Fanning friction factor.
Thus the proportion travelling as contact load is dependent on which in turn is dependent on viscosity. Hence bottom wear should be dependent on viscosity. A further dependence may arise if the increased viscosity results in significant lubricating effect between the sliding/saltating particles and the pipe wall. In this regard, it should be noted that a typical lubricating oil (SAE 30) has a viscosity around 100mPas at normal temperatures. Typical slurry viscosities are significantly less than this suggesting that any lubricating effect will be minimal.
This is further confirmed by wear tests reported by Traynis (1977). Lumps of rock 6 to 75mm in size were tested in water and then in a clay suspension. A clay suspension of density 1031 kg/cubic metre caused only a 15% reduction in wear rate. A further increase in clay density to 1187 kg/cubic metre caused no further reduction in wear.
Observed values of bottom wear can range enormously. For example, for a 20mm top size coal slurry wear rate will be around 10 to 20mm per year in steel pipe. By contrast a 1.5mm top size coal slurry will cause negligible wear rate. For example, a typical wear allowance for such a slurry is .05mm/year most of which is due to corrosion rather than erosion. Thus a reduction in top size by 13
results in a wear reduction of in excess of 400 times. Much of this dramatic reduction is due to the effect of viscosity on particle settling velocity. As the particle size is reduced the slurry viscosity increases resulting in a reduction in over and above that due to the smaller particle size.
4. General Wear
In addition to bottom wear there is also wear due to the transverse velocity component in turbulent flow. Thus in a horizontal pipe wear can occur at the top of the pipe even though gravity is acting away from that wall. At the bottom of the pipe wear will be the sum of the bottom wear component and this general wear component. In turbulent flow the fluctuating transverse velocity is a function of which means it is only weakly dependent on viscosity. On this basis, general pipe wear will be largely independent of viscosity. However, the question of how well the particles follow the fluid eddies will also be important. This will depend on and hence once again on viscosity.
Another aspect which needs to be considered is the thickness of the viscous sub layer near the wall. For water based slurries at typical velocities the thickness of this layer is around 50 microns. Typical median particle sizes for long distance type slurries range from 20 microns for iron ore to 200 microns for coal. Thus the particle size is of the same order as the sub-layer thickness. However, as discussed previously, these slurries have a higher viscosity than water generally in the range 10 to 30mPas. In such slurries the sub-layer thickness will be much higher approximating up to 1mm thick. Particles moving transverse to the flow towards the pipe wall would be expected to be retarded in the sub-layer with a consequent reduction in impact velocity and hence wear rate. In this way, viscosity once again could influence pipe wear.
It is obvious that viscosity influences pipe wear in a complex manner. In practice, the method of predicting wear is to consider wear rates in existing pipelines having slurries of similar particle size and rheology. If the proposed slurry is a particularly unusual one some wear testing may be desirable. This is most commonly performed in a recirculating pipe loop. However, these have the disadvantage of submitting the particles to repeated passage through a pump which can cause rapid attrition if the material is soft e.g. coal. An alternative is a wheelstand rig. The Slurry Systems wheelstand consists of a 206mm ID steel pipe bent into a circle having a diameter of 2.6m. This is rotated about a horizontal axis and driven by a variable speed electric motor at any speed from zero to 22 rpm. This represents peripheral speeds from 0 to 3 m/s. The pipe is half filled with slurry (140 litres). When the wheel is rotated the slurry remains in the bottom half with the pipe wall moving relative to it. The rotational speed is chosen such that the peripheral speed equals the pumping velocity in the pipeline. Wear rate is monitored by measuring the mass loss of the filler plug which is located on the outside circumference of the wheel. The inside surface of the plug is machined to suit the internal pipe profile. With coarse particle slurries detectable mass loss occurs with the steel plug in a few hours. For finer slurries which wear much slower, a plug having a lead insert is used. This wears much faster than steel and enables a detectable mass loss to be obtained in a reasonable time. With soft material such as coal rounding of the particles occurs during transport resulting in reduced pipe wear towards the end of the pipeline. This effect can be monitored in the wheelstand simply by rotating for the required time.
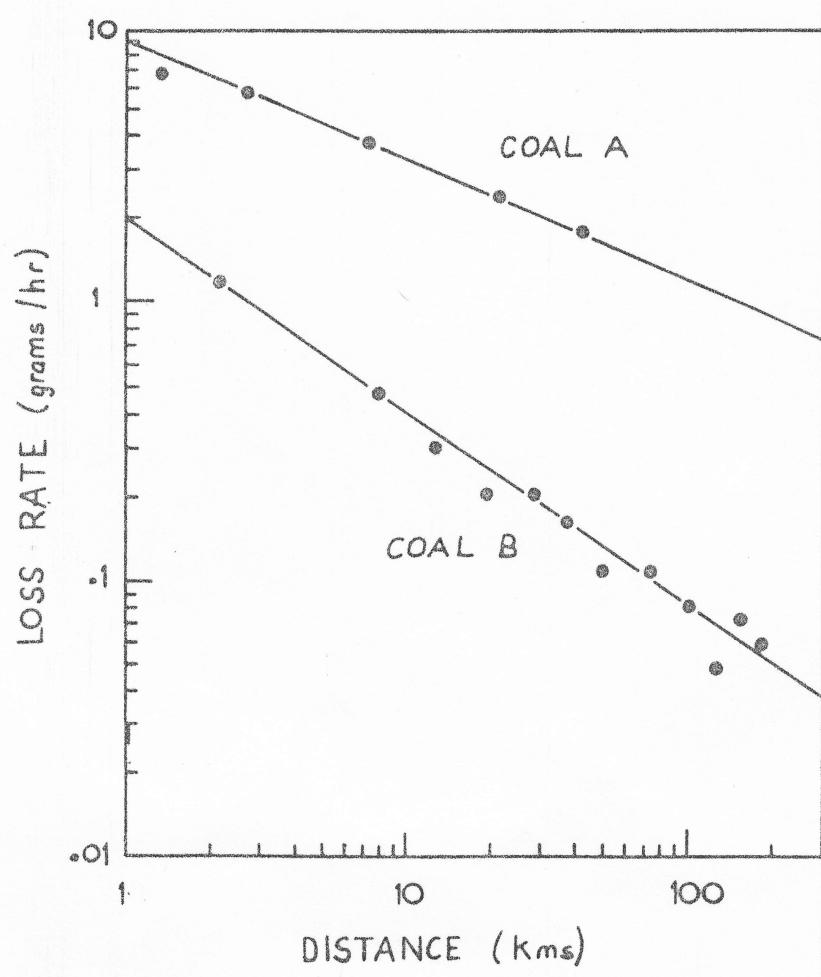
Some results with two coal slurries are given in figure 1. This shows the mass loss rate of the lead plug plotted against distance
travelled. Both coals were minus 20mm with weighted mean particle size of around 9mm and both were tested at 2.2 m/s. Coal A was tested at 22% concentration by volume in water. Coal B was tested at 37% concentration by volume in clay based "vehicle" slurry exhibiting Bingham plastic behaviour. The initial yield stress of this vehicle was 9Pa with a plastic viscosity of 17mPas. This meant that initially the flow was laminar. After 15 kms the slurry was diluted to reduce the yield stress to around 3Pa to ensure turbulent flow. The plastic viscosity was then around 10mPas. During the test the coals attited. The attrition products are predominantly minus 45 microns. In the case of Coal A, this had negligible effect on the viscosity which remained essentially that of water. However, in the case of Coal B the attrition products caused an increase in the yield stress and the plastic viscosity. Because of this some dilution was necessary periodically to maintain the yield stress below 4Pa. Vehicle density was typically about 1180 kg/cubic metre.
Interestingly enough, the slope of the Coal B data appears the same in the first 15 kms as afterwards even though the flow regime changed from laminar to turbulent.
6. Conclusions
Slurry rheology can significantly affect pipe wear rates. At the present time, no analysis is available for predicting its effect. Furthermore, there is virtually no information available in the literature. For any unusual slurry for which rheology may be of importance wear testing is necessary. The wheelstand rig described here is ideal for such tests.
TRAYNIS, V.V. (1977) Parameters and Flow Regimes for Hydraulic Transport of Coal by Pipeline, Terraspace Inc., Rockville, Md, USA.
WASP, E.J., REGAN, T.J., WITHERS, P.A., COOK, P.A.C. and CLANCY, J.T.,
(1963) Pipeline News, 35, 20.
WILSON, K.C. and JUDGE, D.G. (1978) Proc. 5th Int. Conf. on Hydraulic
Transport of Solids in Pipe, Hannover, GERMANY.