This HTML edition contains selectable text extracted from the original PDF. Layout-aware OCR was used to recover reading order, figures and equations; minor recognition errors may remain. Consult the PDF for the authoritative layout, figures and equations.
VISCOSITY EFFECTS IN GOLD PROCESSING
by
A. D. Thomas
Slurry Systems Pty Ltd
1 INTRODUCTION
There is increasing interest in the effect of viscosity on mineral processing plant performance. In any process involving fine particle slurries viscosity influences plant performance either beneficially or adversely.
In general the viscosity will depend on:
- (a) Solids concentration (pulp density)
- (b) Ore type
- (c) Particle size
- (d) Chemical environment
- (e) Previous flow history
Generally c, d and e are determined by the particular process and remain essentially constant from day to day. If the ore type also remains constant the viscosity depends solely on the pulp density. If this is the case the viscosity is effectively monitored by the pulp density and there is no need for a special instrument. However, if the ore type changes from day to day or week to week, viscosity will change even though the pulp density remains constant. In this case the changes in ore type and hence viscosity can upset the control of the process. An independent means of monitoring viscosity may then be desirable.
Viscosity also becomes of importance when the ore body is such that the viscosity at typical processing pulp densities is too high and affects plant performance. In this case the use of thinning additives may be helpful and the addition rate of such additives should be controlled by viscosity measurement.
Similarly if a plant is being pushed to its capacity viscosity effects will generally be the limiting factor. Thinners may then once again be helpful.
Processing steps which are influenced by viscosity are:
- Grinding
- Screening
- Classifying
- Thickening
- Agitation
- Leaching
- Pumping
- Tailings disposal
This paper will give a brief introduction to viscosity fundamentals and then consider in turn its influence on the above processing steps. Finally means of measuring viscosity will be considered.
Fluid flow basically involves a shearing process between layers of fluids. For example, in pipe flow the fluid at the pipe wall is stationary whilst the fluid at the centre of the pipe is moving at the greatest velocity. Thus there is a velocity gradient across the pipe with consequent shearing action between concentric layers of fluid - see Fig. 1.
This shearing action results in a shear stress (force per unit area) at the pipe wall which resists the applied pressure. The balance between the two forces determines the flow rate.
Sir Isaac Newton discovered that for many common fluids, e.g. water, the shear stress ( ) was directly proportional to the velocity gradient or shear rate ( ). He termed the constant of proportionality the viscosity ( ). Thus for a Newtanian fluid
where is constant for a given temperature. For pipe flow this is equivalent to saying
where is the pressure gradient and is the flow rate. In an agitated tank it is equivalent to saying
These equations only apply at low shear rates or velocities and high viscosities where the flow is termed laminar, i.e. the fluid is moving as if plates of fluids, or laminas, are sliding across each other. At high velocities or low viscosities instabilities due to fluid inertia occur and the flow becomes turbulent. The flow is no longer smooth but consists of violent eddying motion. Under most conditions water flows in a turbulent manner. Thus the stream of water flowing out of a hose has a rough surface appearance due to the eddying motion. In contrast the flow of say a motor oil out of a tin has a smooth glossy appearance which is characteristic of laminar flow. Mineral pulps flowing at low densities will generally exhibit a rough surface appearance indicating turbulent flow, whereas at high densities a smooth surface appearance will indicate laminar flow.
The above equations apply to a Newtanian fluid. Mineral slurries cannot in general be classed as Newtanian i.e. the viscosity is not constant, but is itself dependant on the shear rate. Consider Fig. 2. For a Newtanian fluid equations 1, 2 and 3 infer a straight line relationship starting from the origin as shown. The slope of the line is proportional to the viscosity. Mineral slurries generally exhibit behaviour similar to that designated "non-Newtanian" on Fig. 2. For these slurries the shear stress must exceed a certain "yield stress", , before any flow will occur. This is in contrast to a Newtanian fluid where even a small shear stress will cause some flow. Consider the case of a pipeline connected to a variable speed pump. With a dense mineral pulp the pump must reach a certain speed before the pressure is sufficient to exceed the yield stress. Below that speed the pump can turn forever and no flow will occur.
Returning to Fig. 2. At any particular shear rate, e.g. , there is a corresponding shear stress, , and hence a corresponding effective viscosity, .
Similarly at a higher shear rate, , there is a corresponding lower effective viscosity . Thus as the shear rate increases the effective viscosity decreases. Because the viscosity is not constant, but depends on the relevant shear rate it is impossible to speak of a slurry having a certain viscosity. It is only correct to say a slurry has a certain viscosity at a certain shear rate . Alternatively one could say it has a certain yield stress, , and a certain plastic viscosity, , where
i.e. is the slope of the non-Newtonian line of Fig. 2. Equation 4 relates to the Bingham Plastic model.
Note that at low shear rates the effective viscosity is largely determined by the yield stress. At very high shear rates the effective viscosity becomes essentially equal to the plastic viscosity.
3 FACTORS AFFECTING RHEOLOGY
Fig. 3 shows typical rheograms for a leach tank slurry and a tailings. Both the yield stress and the plastic viscosity show a sharp increase with solids concentration as can be seen in Fig. 4.
Particle size also strongly affects slurry rheology. Thus for the same ore type and the same solids concentration the slurry rheology is a sensitive measure of the degree of grinding.
Slurries from different ore bodies can show markedly different behaviour as is illustrated in Fig. 4. This reflects the effect of different mineralogy, clay content, water quality etc.
Changes in the chemical environment tend to change the yield stress, but leave the plastic viscosity relatively unchanged. Such things as pH, electrolyte concentration, flocculants and thinners all affect the yield stress. The effect can sometimes be dramatic. For example increasing the pH a few points can reduce the yield stress by a factor of 10. Addition of flocculants increases the yield stress. Salt in the water also generally causes an increase. Addition of negative ions such as poly phosphates decreases the yield stress. These chemical effects are much more pronounced with finer particles. Therefore the proportion of clay is significant, particularly the swelling montmorillinite (bentonite) clays.
4 EFFECT OF RHEOLOGY ON PROCESS STEPS
4.1 Grinding
It has been known for 20 or 30 years now that viscosity is an important parameter in determining grinding effectiveness. Qualitatively it was observed that a certain viscosity level was desirable and this was attributed to its role in coating the balls with pulp. However once a certain viscosity level is exceeded mill performance decreases. This is attributed to a number of factors such as:
- (a) Increasing viscosity will reduce the velocity of the balls and thus reduce both the energy and frequency of impact.
- (b) With higher viscosity more of the pulp is carried up the ascending wall of the mill out of the zone of ball action.
- (c) High viscosity will inhibit the settling rate of the particles thereby affecting the concentration of particle at the wall.
- (d) Very high viscosities would affect mill throughput simply by limiting the flow through the mill.
Laboratory scale tests using high viscosity Newtonian liquids (e.g. glycerol) instead of water indicate most efficient grinding occurs when the viscosity is around 100 to 300 mPas. (e.g. Clarke and Kitkener, 1968).
Viscosities measured in actual ball mills are often one or two orders of magnitude larger than this, but this is mainly a reflection of the method of viscosity measurement. Up until a few years ago the slurry viscosity was usually measured using a Brookfield viscometer. Measurement involved inserting a rotating spindle into a container of slurry. Whilst this instrument does accurately measure the viscosity of a Newtonian fluid, with a non-Newtonian fluid the measured viscosity only applies at a certain shear rate which itself depends on the properties of the fluid being measured. Thus it is difficult to compare the viscosity results.
Recently it has been realized that this non-Newtonian behaviour must be considered. In particular the yield stress has been found to be of key importance (e.g. Klimpel, 1984). Coal grinding data of his indicates the production rate starts to fall off rapidly when the yield stress exceeds 10 to 20 Pa. Typical gold ore grinding mills operate somewhat below this at around 5 to 7 Pa. In cement plants ball mills typically operate at 20 to 40 Pa.
Various chemical additives have been proposed as grinding aids to improve production. It is now realized that there dispersants act by reducing the yield stress thereby allowing operation at higher concentration.
4.2 Screening
Any increase in viscosity decreases the capacity of a screen. Consider a typical 0.6mm trommel screen in a leach tank. The pressure force driving the slurry through the screen apertures is due to the static head of slurry, typically around 300mm.
Fig 5a shows the calculated flow rate as a function of slurry yield stress for a 1m diameter x 2m long trommel screen assuming the holes represent one third of the area. The actual flow rates will depend on screen details, but the graph does indicate the type of variation to be expected. Typically leach tank slurries have yield stresses around 5 to 7 Pa. It can be seen that a doubling of the yield stress to around 12 Pa would reduce the flow rate from around 200 cub.m/hr to around 60 cub.m/hr. Once the yield stress exceeds about 20Pa no slurry will flow through the screen. In this case the available static head is not sufficient to overcome the yield stress.
As noted earlier the relationship between yield stress (and plastic viscosity) and concentration depends on a number of factors including ore type. Using data for a particular ore type the curve of Fig 5a can be redrawn as flow rate versus concentration. For this particular example at 200cub.m/hr the concentration is 45%. Increase in concentration to 58% results in zero flow through the screen.
In section 3 it was explained how addition of thinners reduces the yield stress but has little effect on the plastic viscosity. The screen flow calculations have been re-done with the assumption that the yield stress is reduced to zero by the addition of a thinner, but the plastic viscosity remains the same. The new relationship between flow rate and concentration is shown in Fig 5b. For 200 cub.m/hr the allowable concentration has increased from 45% to 54%. The tonnage throughput increases from about 135tph to around 180tph.
4.3 Cyclones
Hydrocyclones classify particles according to their settling velocity. The settling velocity depends in terms of the slurry viscosity. The performance of cyclones is measured in terms of the which is defined as the particle diameter which would report equally to the overflow and the underflow. Bradley (1965) reports that is proportional to the square root of viscosity. In the case of a slurry the relevant viscosity is the effective viscosity at the shear rate in question (see Fig 2.). In a cyclone the shear rates would be expected to be quite high and hence the effective viscosity would be expected to be virtually equal to the plastic viscosity. On this basis the would be expected to vary as the square root of the plastic viscosity.
However, a recent study at the Western Australian Institute of Technology found that the was proportional to the square root of the yield stress. This could indicate the shear rates are not as high as believed. Alternatively it could be that for the slurry tested both the yield stress and the plastic viscosity increased at a similar rate with concentration increase.
4.4 Thickeners
The thickening of slurries is involved with rheology. The yield stress of a slurry is basically a measure of the elastic strength of flocs. These flocs are "puffy" clusters of particles with water trapped between them. They can occur naturally due to the attractive forces between particles, given the right electro-chemical environment. They can also be formed artificially by long chain polymer flocculants. Either way the presence of a yield stress indicates a flocculated slurry. Because flocs are much larger than the individual particles they settle much faster. Thus whereas unflocculated micron sized clay particles might only settle at about 3mm/hr flocculated material might settle 1000 times faster.
A dilute slurry entering a thickener might initially settle freely until a concentration is reached such that the flocs are packed together in contact with each other. At this point the rate of settling decreases markedly and further consolidation takes place as a result of compression of the bed of flocs with water being squeezed out from inside each floc. The weight of the
fluid above the bed is supported by elastic strength of the floc structure. A measure of the strength of the structure is the compressive yield stress. This is about 1000 times the shear yield stress measured in a viscometer. However the two yield stresses show a similar dependance on concentration so that thickener performance can be related to the shear yield stress. For example the yield stress of the underflow is related among other things to the height of the thickener.
A high flocculant addition rate results in big flocs and hence initially rapid settling. However these big flocs have a higher yield stress meaning that for a given height of thickener the underflow concentration is low. Thus the rate of thickening and the underflow concentration must be balanced against each other. Shearing action will tend to break these flocs and this is utilized in some high rate thickeners.
4.5 Agitated Tanks
The shear rate in agitated tanks is relatively low. This means the effective viscosity is strongly dependant on the yield stress. Typical values of slurry yield stress in leach tanks is in the range 3 to 10 Pa.
For these slurries the power consumed by an agitator is approximately proportional to viscosity to the one fifth power, which means in this case
i.e. If the yield stress increases from 3 to 10 Pa the power would rise 27%.
In an agitated tank the circulation time is a useful parameter which has a strong influence on the leaching process. The circulation time is defined as the average time required for a fluid element to complete one circulation around the tank. In the region of interest with gold slurries it has been found that the circulation time is also proportional to viscosity to about the one fifth power i.e.
This indicates that a doubling of the yield stress will result in 13% slower leach time, other factors being equal.
4.6 Pumping
In gold processing plants most pipelines operate under turbulent flow conditions. In this case the pressure gradient is only weakly dependant on viscosity. The approximate relationship is:
Thus a doubling of the plastic viscosity will increase the pressure gradient by only 11%.
However this only applies when the flow is turbulent. For a given flow rate, as the slurry is made more viscous the flow will eventually cease to be turbulent and become laminar.
Fig 6 shows the calculated pressure loss over 1km of 150mm pipe for slurries of four different yield stress values, 7, 10, 15 and 20 Pa. The flat curves on the left hand side represent laminar flow behaviour. Once a certain velocity is exceeded the flow becomes turbulent in which case the pressure gradient varies approximately as the square of the velocity.
Also shown on Fig 6 is a typical centrifugal pump curve. Consider a tailings having a yield stress of 7Pa. At a typical flowrate of 120 cub.m/hr in a 150mm pipe Fig 6 indicates a pressure of 410 kPa under turbulent flow conditions. Increasing the yield stress to 10Pa has only a small effect on the turbulent flow pressure gradient with the pump curve now intersecting at 112 cub.m/hr at 420kPa i.e. there is little effect on the pumping.
However a further increase in yield stress to 15Pa has a dramatic effect. The pump curve now intersects the laminar flow curve. As a result there is a big drop in flowrate to 70 cub.m/hr.
A further increase in yield stress to 20Pa will result in zero flow since the pump curve does not intersect the system curve i.e. the pump pressure is not sufficient to exceed the yield stress of the slurry.
4.7 Tailings Disposal
Conventional tailings disposal involves pumping a relatively dilute slurry (yield stress around 3Pa) to a tailings pond. At this yield stress the coarser particles segregate out near the discharge point and a sloping beach is formed. The finer particles will flow towards the centre of the pond. Just as previously explained in regard to a thickener, the settled concentration of these fines depends on the equilibrium between the height of the deposit and the yield stress. Because the coarser fraction has already dropped out the remaining fines have a low concentration for a given yield stress. This means the settled concentration deposit remains moist for many years. From an environmental viewpoint these tailings ponds are not ideal.
An alternative method of tailings disposal known as the thickened discharge method has recently been proposed (Robinsky, 1975). This involves thickening the slurry to higher densities than normal. The higher yield stress of the thickened slurry means that the coarser particles do not segregate out at discharge. Also being thicker, the slurry forms a natural slope, (which depends on the yield stress). Because the concentration is high, minimal water drains out. The tailings deposit takes the form of a cone shaped to contain with a slope of around 5%. Only a small perimeter wall is required to contain any rainfall run off and any low density off specification slurries. The nature of the deposit is such that it dries out completely and forms a stable hill which can be re-vegetated.
5 RHEOLOGY RELATIONSHIP BETWEEN PROCESS STEPS
production, but be detrimental to thickener performance. This is because a thinner essentially de-flocculates the slurry which is the opposite to what is wanted in a thickener. Similar comments apply to tailings disposal where a degree of flocculation results in rapid settling.
6 MEASUREMENT OF RHEOLOGY
6.1 Laboratory Viscometer
At a laboratory scale the viscosity of slurries is usually measured in a rotational viscometer. The slurry is sheared between a rotating bob and a stationary cup. The measured torque on the bob is proportional to the shear stress and the rotational speed determines the shear rate.
An alternative method is to force the slurry through a tube. The pressure gradient is proportional to the shear stress and the flow rate determines the shear rate. A tube viscometer tends to be less convenient at the laboratory scale.
6.2 On-Line Viscometers
The continuous on-line measurement of viscosity is not easily accomplished. A number of rotational types have been built. These involve taking a substream from the main flow and passing it through a container in which a bob is rotated. The problem is that the device must be sensitive enough to measure the small torques involved, but at the same time robust enough to withstand the rigours of a processing plant. Other problems are settlement of coarse particles and consequent blockages.
Another approach is to measure the drag shear force on a plate placed in the stream. This is sensitive to flow velocity and is subject to wear.
Inherently the tube viscometer concept appears more suited to on-line viscosity measurement. The main requirement is that the flow in the tube is laminar, not turbulent. In plants where very viscous slurries are handled, e.g. cement plants, the flow in the plant piping is laminar. In this case measurement of pressure gradient and flow rate in a section of horizontal pipe will enable a measure of the viscosity. This utilizes two robust, well proven instruments - the magnetic flow meter and the pressure transmitter.
In gold plants the flow in process pipes is generally turbulent. Laminar flow can be obtained by expanding the pipe diameter over a test length or by taking a substream. Depending on the specific application one of these approaches will result in a robust, dependable viscosity measuring system.
7 CONCLUSIONS
Slurry viscosity is relevant to nearly every step in gold processing. Although often not measured it does in fact dictate the operating densities in nearly every step. For any one plant with reasonably constant ore type the viscosity becomes simply dependant on pulp density and measurement of that quantity will suffice. However if the ore type varies significantly and/or if maximum production is desired it may pay to monitor viscosity directly.
REFERENCESBradley, D.
"The Hydrocyclone", Pergamon Press, Oxford, 1965.
Clark, B. & Kitchener, J.A.
"The Influence of Pulp Viscosity on Fine Grinding in a Ball Mill
Klimpel, R.R.
"Influence of Material Breakage Properties and Associated Slurry Rheology on Breakage Rates in Wet Grinding of Coal/ores in Tumbling Media Mills", Reagants in the Minerals Industry, Instn. Min. Metal., London, 1984, pp 265-269
Robinsky, E.I.
" Thickened Discharge - A New Approach to Tailings Disposal", Bulletin, Can. I.M.M., Dec 1975, pp47-59
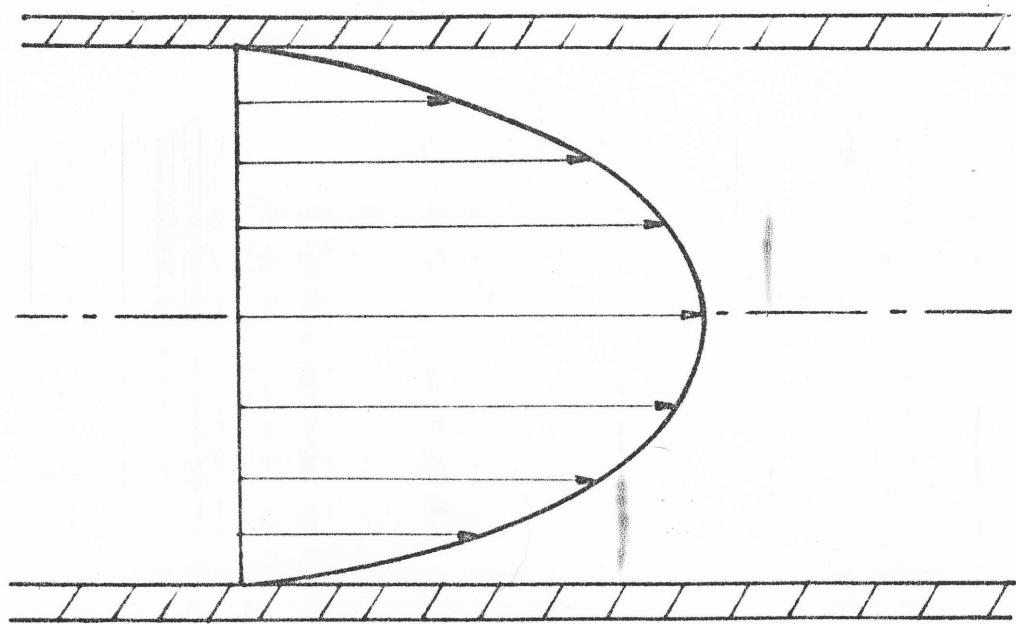
Fig. 1 Velocity profile in pipe
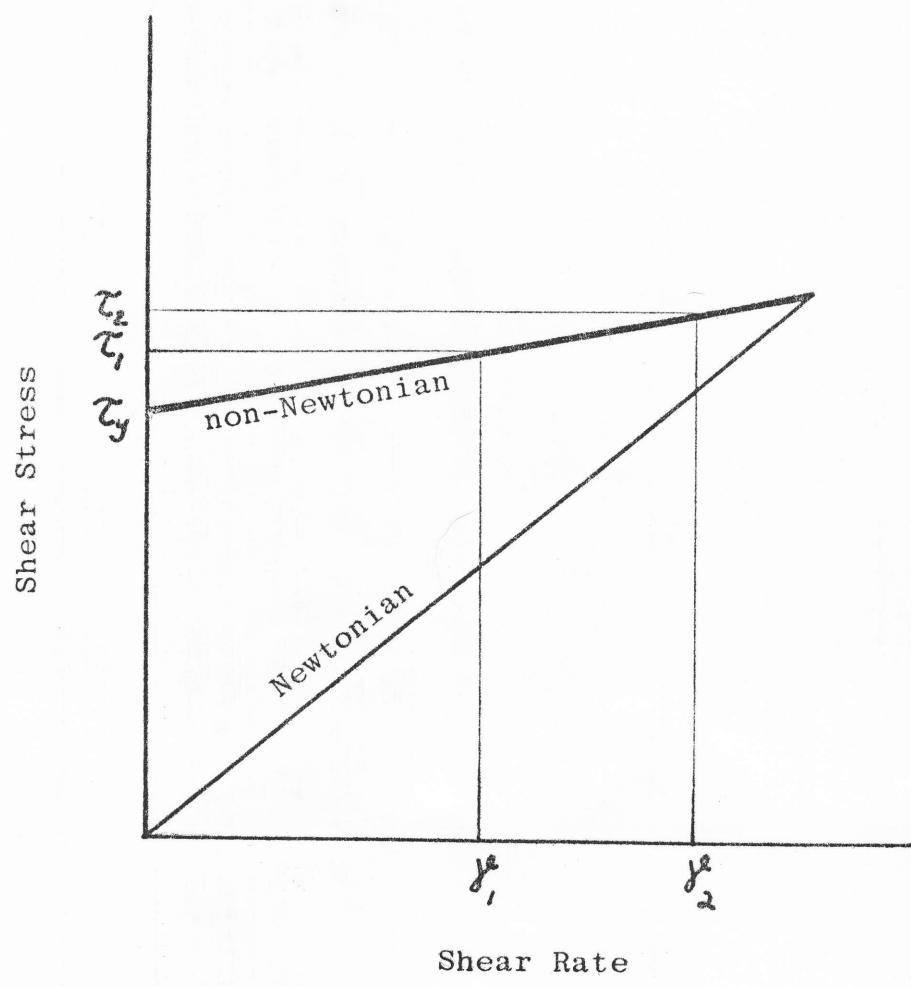
Fig. 2 Non-Newtonian Flow Curve
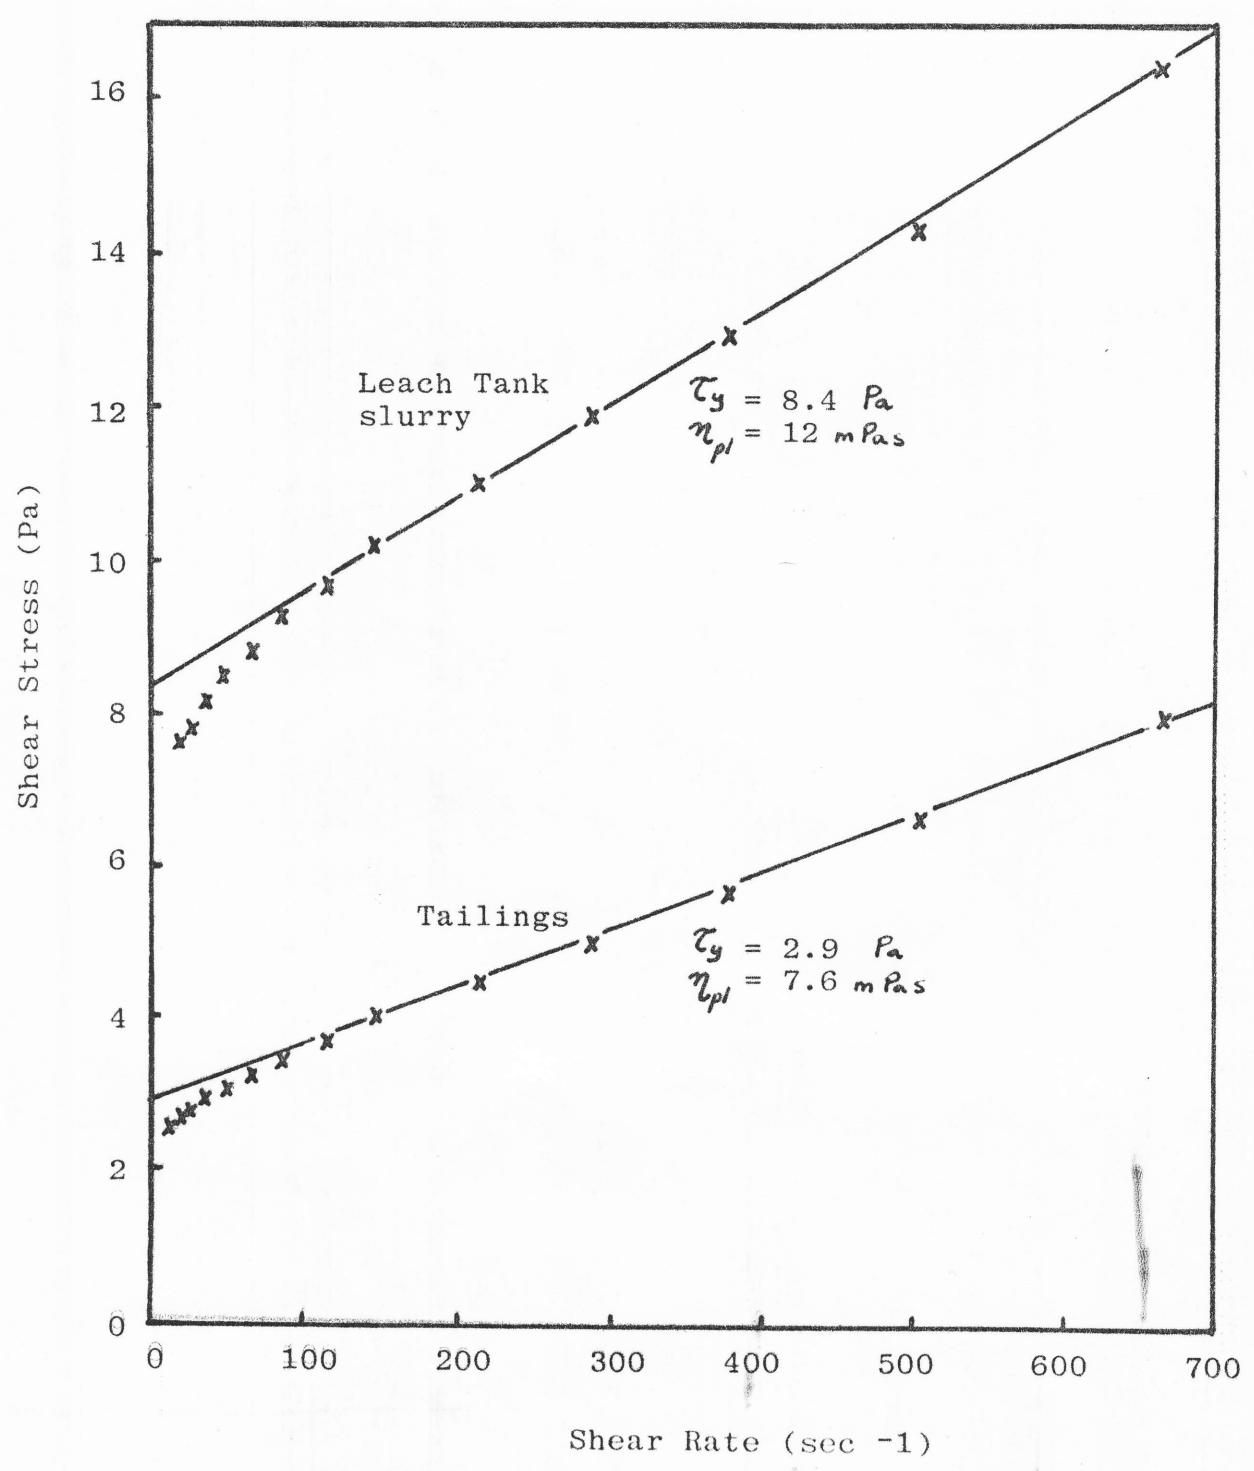
Fig. 3 Typical Gold Slurry Rheograms
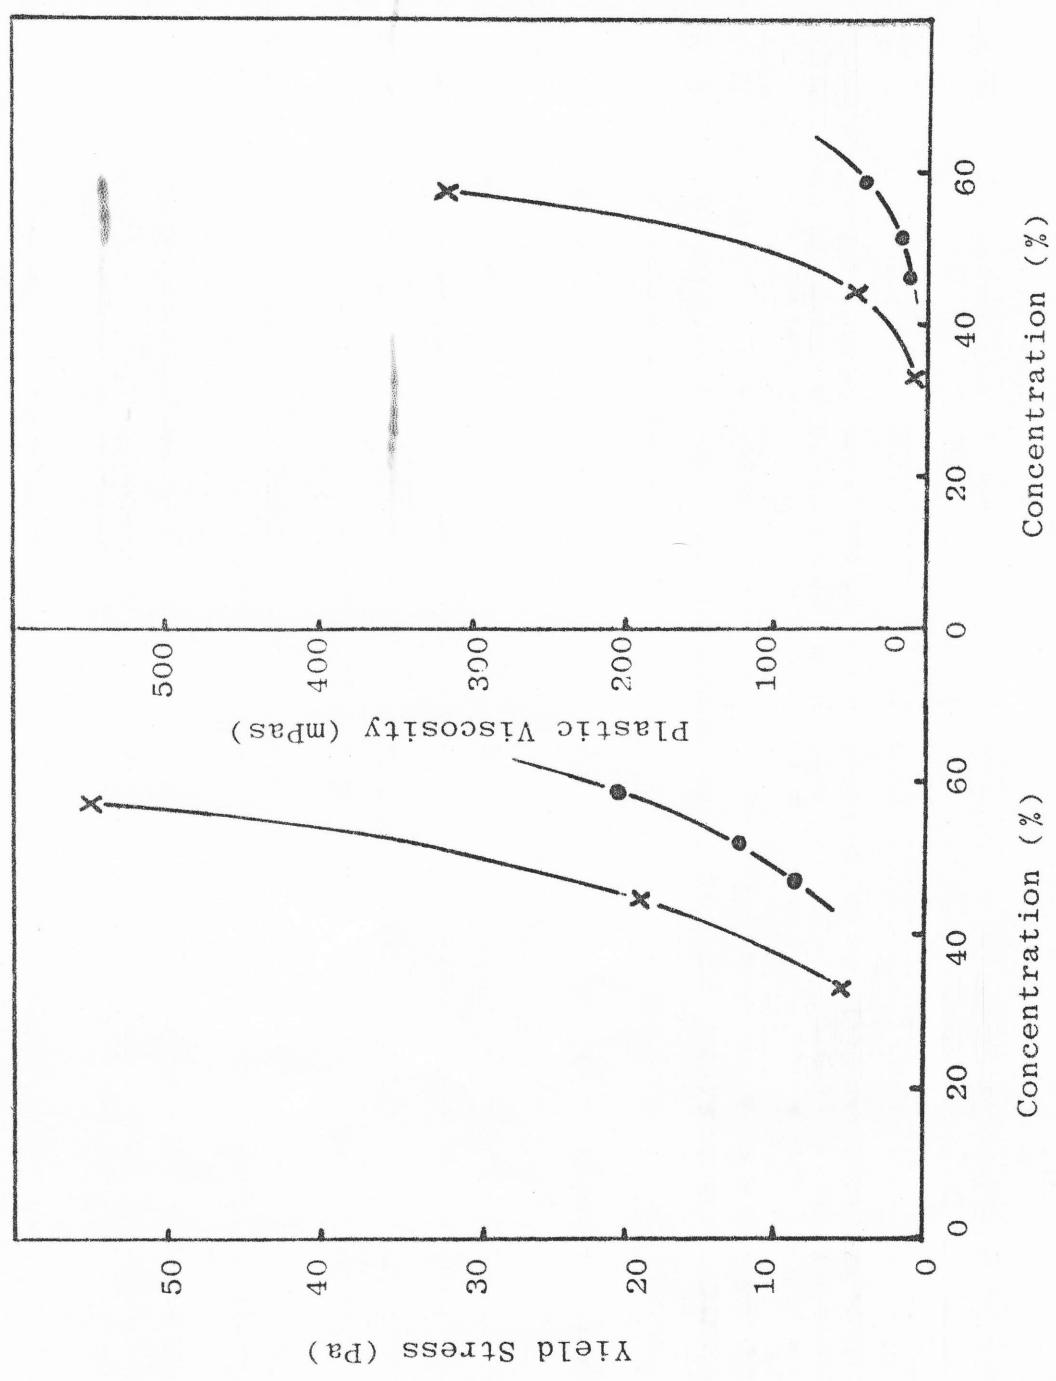
Fig. 4 Typical variation in rheology between different gold mines.
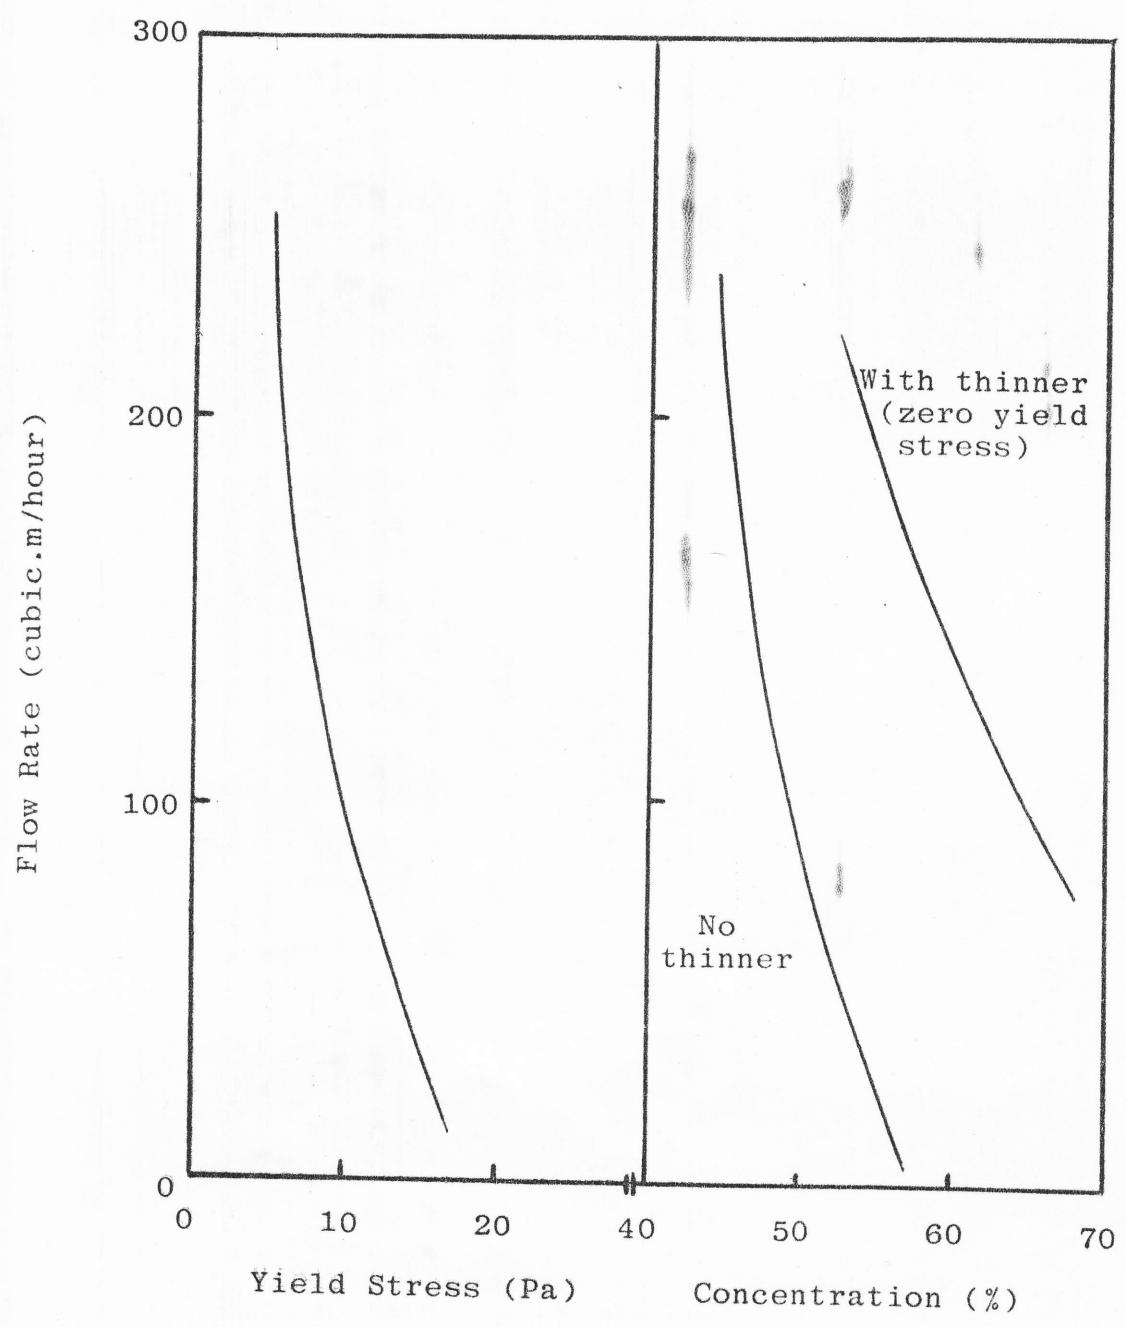
Fig. 5 Effect of Rheology on flow rate through a trommel screen.
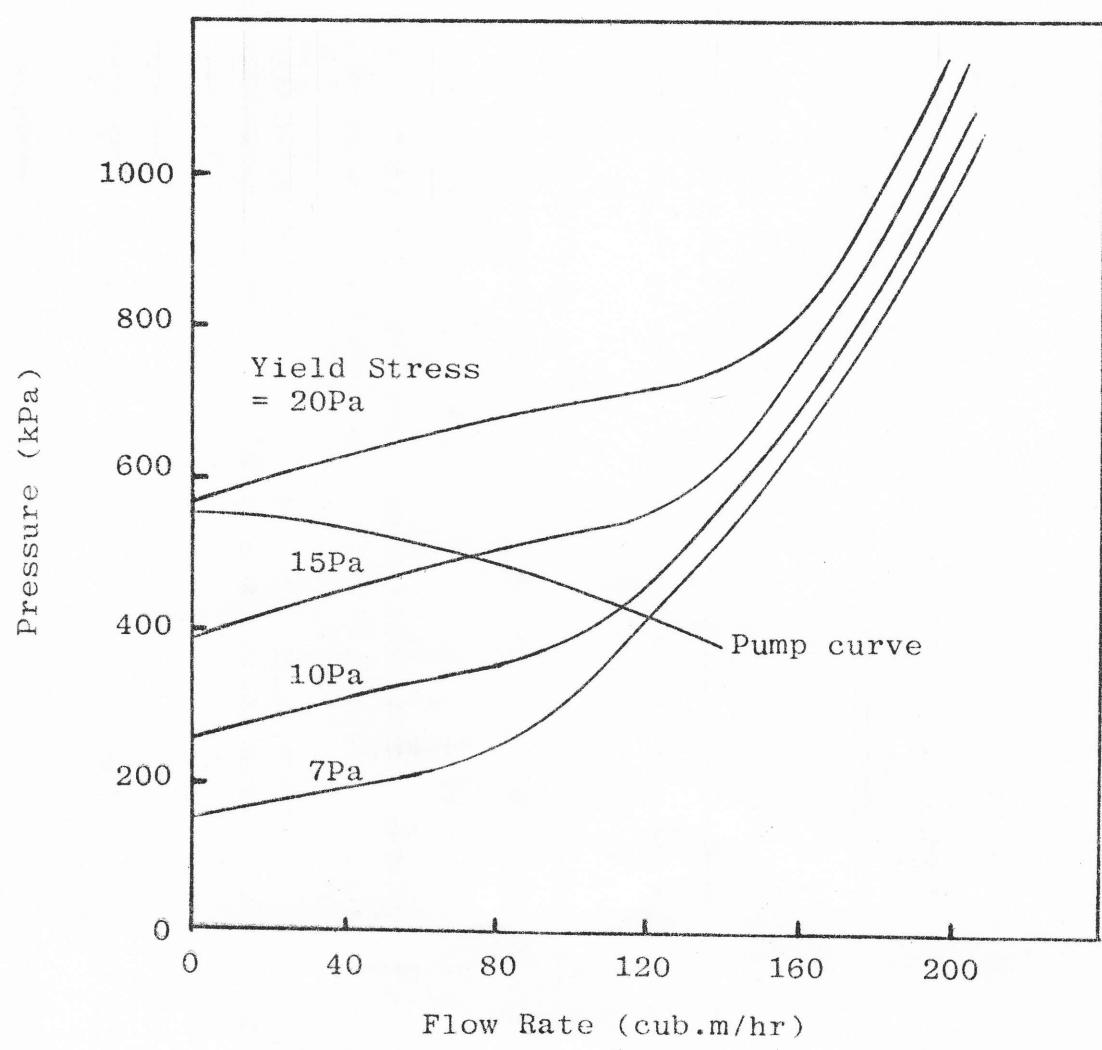
Fig. 6 Effect of rheology changes on tailings line performance. Length 1km, pipe diameter 150mm.