This HTML edition contains selectable text extracted from the original PDF. Layout-aware OCR was used to recover reading order, figures and equations; minor recognition errors may remain. Consult the PDF for the authoritative layout, figures and equations.
Rheology in the Mineral Industry II
March 14-19, 1999
Kahuku, Oahu, Hawaii
United Engineering Foundation
THE INFLUENCE OF COARSE PARTICLES ON THE RHEOLOGY
OF FINE PARTICLE SLURRIES
Allan D. Thomas
Slurry Systems Pty Limited
7 Cantwell Rd, Lochinvar, NSW 2321, Australia
T:61 2 4930 7309; F:61 2 4930 7770; E:
[email protected]
ABSTRACT: The influence of coarse particles on the rheology of fine particle slurries is studied based on well known expressions for the effect of rigid particles on the viscosity of a Newtonian fluid. Recent rheology measurements involving addition of various sands to slimes slurries are used to develop semi-theoretical correlations. The developed equations are shown to describe the trends evident with more common continuous particle size distribution slurries. This is illustrated by recent rheology measurements on 14 different mineral slurries.
INTRODUCTION
Slurries of interest in the mineral industry can range from all colloidal, clay type slurries, to wide particle size distribution ball mill products, to gapped particle size distributions consisting of almost mono-sized granular material suspended in a clay slurry. The rheology of all three types can be measured in a viscometer. For colloidal sized particles the principal forces determining the rheology are attractive forces dependant on surface chemistry and molecular dispersion forces. The relative strength of the attractive and dispersive forces determines the rheology ,Makosko (1). For a given solids concentration the rheology increases with decreasing particle size and chemical influences such as pH are important. For coarser particles (say greater than 10 microns), hydrodynamic and interparticle reaction forces largely determine the rheology.
COARSE PARTICLES IN NEWTONIAN FLUIDS
When solid particles are suspended in a Newtonian fluid the viscosity is increased. Einstein (2) first analysed the hydrodynamic effect of dilute concentrations of spheres arriving at the classic equation:
Numerous extensions of this equation have since been proposed. For example D.G. Thomas (3) measured the viscosity of numerous suspensions and developed the empirical equation:
In modelling the effect of both sperical and non-sperical particles and mono and wide particle size distributions, a key parameter is the ratio where is the volume concentration at the maximum packing density. For example Landel et al (4) found that the following equation (3) described the influence of a range of sperical and non-sperical particles having both mono and wide size distributions. Equation 3, with , approximates equation 2.
Most of the experimental data supporting the above equations was obtained in small scale rotational or tube viscometers. Data obtained in larger diameter pipes by the present author, Thomas (5), (6), (7) and Shook et al (8), also support these results. These authors tested various size sands in high viscosity Newtonian fluids in horizontal pipes. Under laminar flow conditions the sand slowly settles and for coarse particles in low viscosity fluids a moving or stationary bed forms. Data pertaining to these conditions cannot be used in comparing with equations 2 and 3. Only data for which the ratio of fluid viscosity to particle size was sufficiently large to ensure near homogeneous flow were used. The test data were plotted as pressure gradient versus velocity on log-log co-ordinates. This enabled the laminar and turbulent flow regimes to be identified. Laminar flow slurry data which parallel the laminar flow fluid only curve were judged as flowing near homogeneously.
Using this criteria the following data were used to compare with equation 2: Thomas (5,6,7) (105 mm pipe); 0.82 mm sand in 270 mPas fluid, ; 0.13 mm sand in 2000 mPas fluid, ; 0.13 mm sand in 160 mPas fluid, . Shook et al (8) (52.5 mm pipe): 0.18 mm sand in 38 mPas fluid, ; 0.18 mm sand in 38 mPas fluid, ; 0.18 mm sand in 38 mPas fluid,
The results are shown in Figure 1. Also shown in Figure 1 is the predicted relationship according to equation 2 and equation 3 (with ). The data confirm the general trends predicted by equations 2 and 3.
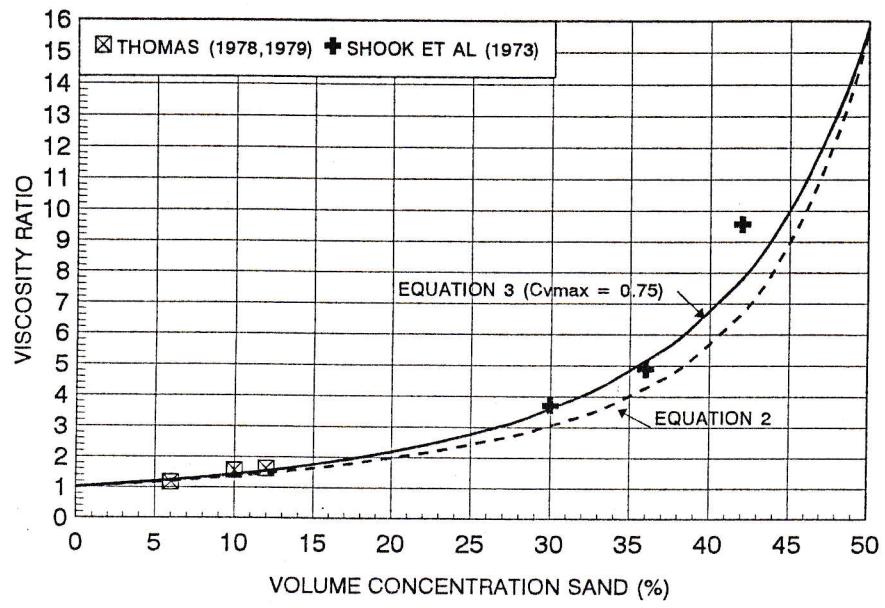
FIGURE 1. VISCOSITY RATIO VERSUS VOLUME CONCENTRATION SAND IN NEWTONIAN FLUIDS IN 50 & 100 mm PIPES
COARSE PARTICLES IN NON-NEWTONIAN VEHICLE SLURRIES
Bingham Parameter Variation with Volume Concentration of Coarse Particles
The rheology of slurries is often described by the Bingham Plastic model:
The addition of coarse particles to a colloidal non-Newtonian Bingham Plastic clay slurry can be expected to increase the rheology of the clay slurry. Thomas (2) presented limited data which indicated that both the Yield Stress and the Plastic Viscosity increase in a similar manner as described above for coarse particles in Newtonian fluids.
The author has recently completed two series of tests on mine tailings which involved addition of sand to slimes slurries. The results of these tests can be used to further investigate the effect of coarse particles. The testwork was conducted in a Contraves Rheomat 115 rotational viscometer. Two bob and cup systems were used. The "A" System used a bob of diameter 48.56 mm and a cup diameter of 48.10 mm giving a gap of 1.27 mm. The "B" system used a bob of 30.00 mm diameter and a cup of diameter 32.50 mm giving a gap of 1.25 mm. Shear rates ranged from to .
The Series 1 tests involved testing four different sands in a minus 10 micron slimes slurry. The Series 2 tests involved testing one sand in a minus 45 micron slimes slurry. Details of the sand properties are summarised in Table 1.
TABLE 1 SAND PROPERTIES
|
Size
(Microns) |
Size
(Microns) |
Size
(Microns) |
|
|---|---|---|---|
| Series 1 Tests Sand SG 3.93 | |||
| Minus 600 micron sand | 470 | 350 | 160 |
| Minus 425 micron sand | 360 | 230 | 105 |
| Minus 300 micron sand | 220 | 150 | 80 |
| 600 x 300 micron sand | 520 | 450 | 350 |
| Series 2 Tests Sand SG 2.86 | |||
| Minus 600 micron sand | 430 | 320 | 200 |
The tests were conducted rapidly to minimise any effects due to sand settling in the viscometer gap during the test. If settling effects were evident the sample was mixed at each shear rate increment during the test. In spite of these precautions some results in the Series 1 tests at low slimes concentrations were clearly influenced by settling of the sand particles. This resulted in data applying to slimes Yield Stress values less than 6 Pa, 10 Pa, 2 Pa, and 35 Pa for the minus 600 micron, minus 425 micron, minus 300 micron, and 600 x 300 micron sands respectively, being rejected. It can be noted that for all data included, the slimes Yield Stress was about an order of magnitude higher than that required for static stability as given by the following equation, Thomas, (10). i.e. all slurries were completely stable under static conditions with the slimes Yield Stress preventing sand settling.
The viscometer data were analysed using the Bingham Plastic model. All data closely followed the Bingham model at shear rates above . For shear rates below the data deviated from the Bingham model and this low shear rate data was not used. The Bingham parameters were determined for the slimes alone at various slimes concentrations and for various additions of sand. Figure 2 shows the Yield Stress ratio versus the volume concentration of sand for the Series 1 and 2 tests. The Yield Stress ratio is the Yield Stress measured with sand addition divided by the Yield Stress of the slimes alone. The data for Series 1 and 2 tests apply to a range of slimes concentrations. Also shown in Figure 2 are results for 0.2 mm sand in clay in a 9.41 mm diameter pipe, Thomas (11), zircon flour in clay measured in a rotational viscometer, Thomas (2), and minus 20 mm coal in a 152 mm diameter pipe, Duckworth et al (12).
Given the range of test conditions all results are remarkably consistent. The data of Figure 2 are best fitted by the following equation with equation 3 with rather than which applied in Figure 1.
where is a correlating parameter. The product is used to correlate data such as in Figure 2. Inclusion of provides a physical rationale to predict the likely rheology of say a wide size distribution sand based on narrow size distribution sand data. Because of the relatively narrow particle size distributions of most of the sands tested will be around 0.6, so the product indicates a value around 1.5.
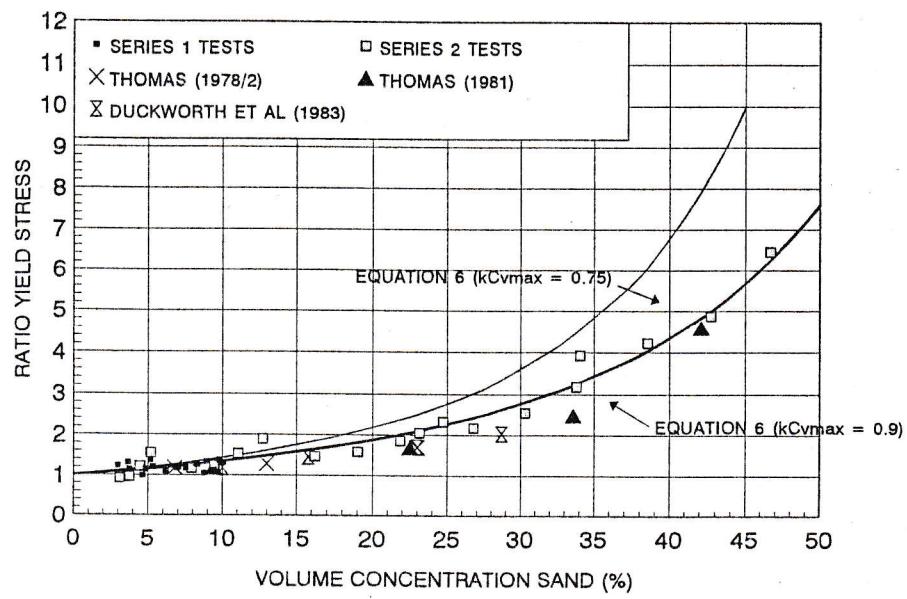
FIGURE 2. YIELD STRESS RATIO - (SAND+SLIMES)/SLIMES
Figure 3 shows an analogous plot for the same data for the ratio of the Plastic Viscosity with coarse particles and the Plastic Viscosity of the vehicle slurry alone. Compared with Figure 2 there is considerably greater scatter in the results. The effect of coarse particle addition can be correlated by the following equation (7), analogous with Equation 3. Equation 7 predictions with and 0.9 roughly encompass the range of results.
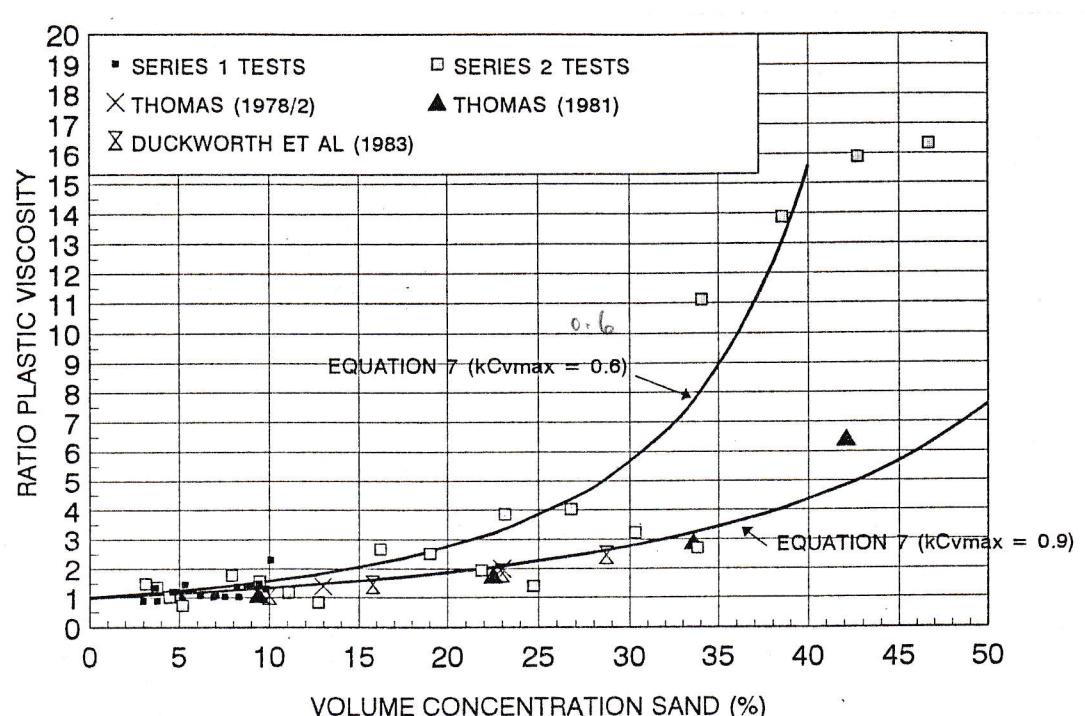
FIGURE 3. PLASTIC VISCOSITY RATIO (SAND+SLIMES)/SLIMES
Bingham Parameter Variation with Total Solids Concentration
Figures 2 and 3 show the Yield Stress and Plastic Viscosity ratios plotted against volume concentration of coarse particles. An alternative method of presentation involves plotting the measured Yield Stress and Plastic Viscosity against total solids concentration. In this case the ratio of coarse particle volume to total solids volume ( ) is a parameter.
Figure 4 shows the Series 2 test Yield Stress results plotted in this manner. The data show that, for any given total volume concentration, increasing ratio of sand addition results in a decrease in Yield Stress. For example at a total volume concentration of 20% the slimes alone exhibit a Yield Stress around 85 Pa. Addition of sand in the ratio results in the Yield Stress decreasing to 37 Pa at the same total solids concentration of 20%. Increasing the ratio of sand to results in a Yield Stress of around 12 Pa at 20% total concentration. This behaviour is as expected and is a reflection of the physical fact that for any given total solids concentration the rheology of a slurry increases with decreasing particle size or decreases with increasing particle size. Increasing addition of sand to the slimes increases the average particle size and therefore decreases the Yield Stress.
An important trend evident in Figure 4 is that the slope of the Yield Stress versus total volume concentration plot on log-log co-ordinates increases as the sand ratio increases. The data for the slimes alone are approximated by a straight line of slope 5.6 (after allowing for the different X and Y axis scales). As increasing ratios of sand are added the slope progressively increases to approximately 11.5 at the highest ratio .
It is well known that the Yield Stress of colloidal slurries is generally correlated by an equation of the following form:
Although there is considerable scatter, the slimes data in Figure 4 are approximated by an equation of this form, with and . Yield stress is in Pascals and is the volume fraction of slimes solids expressed as a fraction. Equation 8 infers a straight line plot of versus and is a well known relationship. Perhaps not so well known is that with slimes Yield Stress correlated by a straight line, addition of sand results in the Yield Stress versus volume concentration plot following a slightly more curved path. This is evident from a close inspection of Figure 4 data.
The reduction in Yield Stress for a given total concentration and the increase in the slope of the versus as the mean particle size increases, are both predicted by application of equation 6 as is revealed by the following analysis. Also predicted is the change in behaviour from a straight line relationship for colloidal slurries to a slightly more curved relationship as coarse particles are added.
It was previously seen in Figure 2 that the effect on the Yield Stress of sand addition was correlated by equation 6 with . Combining equations 6 and 8 we arrive at the following equation (9) for the Yield Stress of the total mixture.
Thomas (9) developed an analogous equation but based on a different expression than that in equation 6. The full lines predicted by the data in Figure 4 represent the predicted Yield Stress using equation 9. The predicted Yield Stress is close to the measured Yield Stress.
A similar expression as equation 9 can be developed for the Plastic Viscosity. The Plastic Viscosity of colloidal slurries is often correlated by the following equation:
Combining equations 7 and 10 we derive the following equation.
The applicability of this equation is illustrated in Figure 5 which shows the Series 2 Test data plotted as Plastic Viscosity versus total solids Volume Ratio with the volume ratio of sand to total solids, , as parameter. The dashed lines represent curves fitted to the data whilst the full lines are predicted curves using equation 9 with and . This value of is in the middle of the 0.60 and 0.90 extremes shown in Figure 3. The predicted behaviour does not fit the data as well as was seen for the Yield Stress (Figure 4) as was previously seen in relation to Figure 3. Nevertheless the predicted trends are correct. As the sand ratio increases the slope of the curve decreases and this is predicted by equation 9. Equation 9 also predicts a slightly curved relationship which is also evident in the data. For any given total Volume Ratio the Plastic Viscosity decreases as the sand ratio increases.
The Importance of the Ratio
A useful parameter which characterises the degree of non-Newtonian behaviour of a slurry is the ratio of Yield Stress to Plastic Viscosity. For a slurry containing a high
proportion of coarse particles the Yield Stress will be low and the ratio will be low. Conversely for a highly non-Newtonian clay slurry this ratio is high. These trends are evident in Figure 6 which shows the ratio versus the calculated mean size for Series 2 test results. The ratio is that applying at a Yield Stress of 10 Pa. A Yield Stress of 10 Pa was selected since typical mineral slurry pumping involves a Yield Stress around this magnitude.
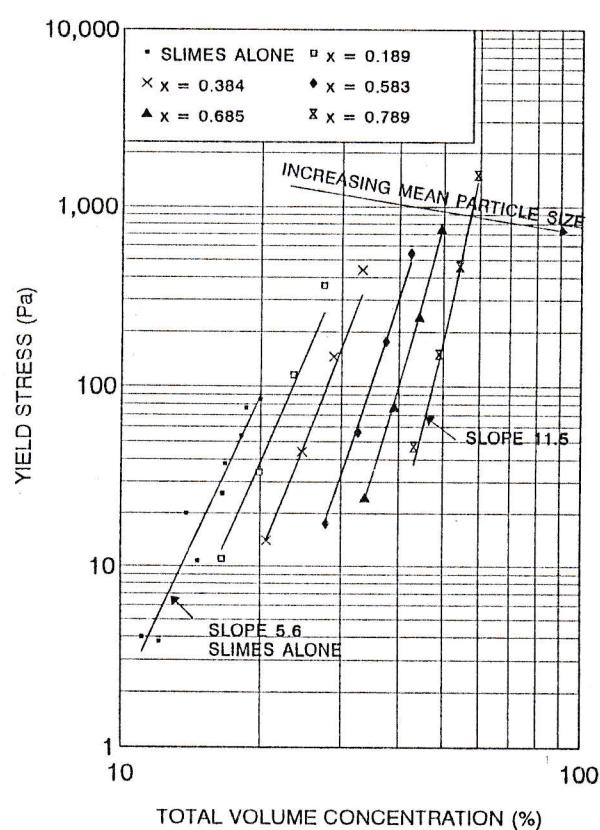
FIGURE 4. YIELD STRESS VS VOLUME CONC.
SERIES 2 TESTS SAND IN SLIMES
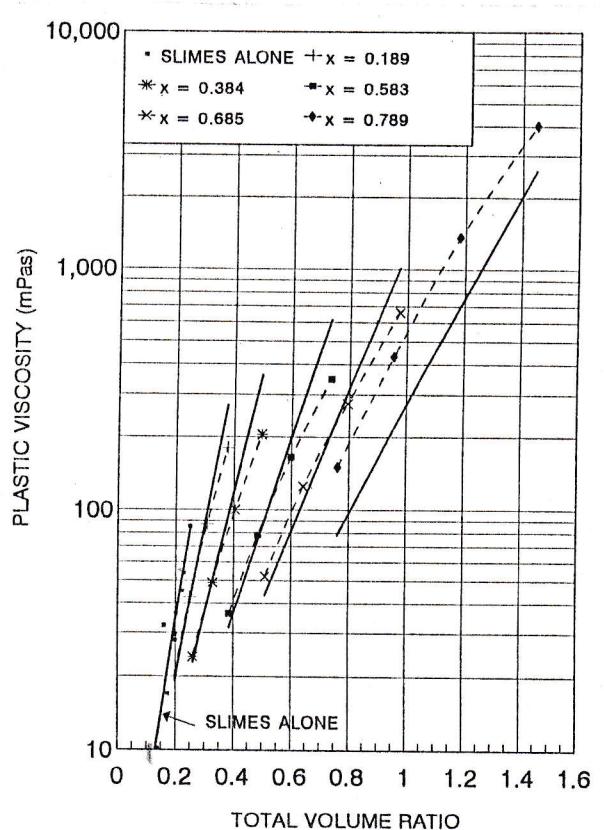
FIGURE 5. PLASTIC VISCOSITY VS VOLUME RATIO
SERIES 2 TESTS SAND IN SLIMES
With the Yield Stress in Pascals and the Plastic Viscosity in Pascal seconds the units of are . The mean size is calculated by assuming the mean size of the sand is 45 micron slimes is 10 microns. Because of the overwhelming influence of the sand on the mean size the combined mean size is not very sensitive to assumed mean size of the slimes. For example assuming a mean slimes particle size of 1 micron instead of 10 microns makes little difference to the calculated total mean size.
Figure 6 illustrates the expected trend for the ratio to decrease as the mean particle size increases. In the limit of very coarse particles the ratio tends to zero indicating Newtonian behaviour. Also shown in Figure 6 is the predicted relationship using equations 9 and 11. The predicted behaviour shows less reduction in the ratio. This is explained by the fact that the Yield Stress selected for the comparison, , is lower than the measured Yield Stress values (see Figure 4). Hence both the Yield Stress and Plastic Viscosity data have had to be extrapolated to considerably lower concentrations and volume ratios where the predicted behaviour diverges significantly from the indicated experimental behaviour.
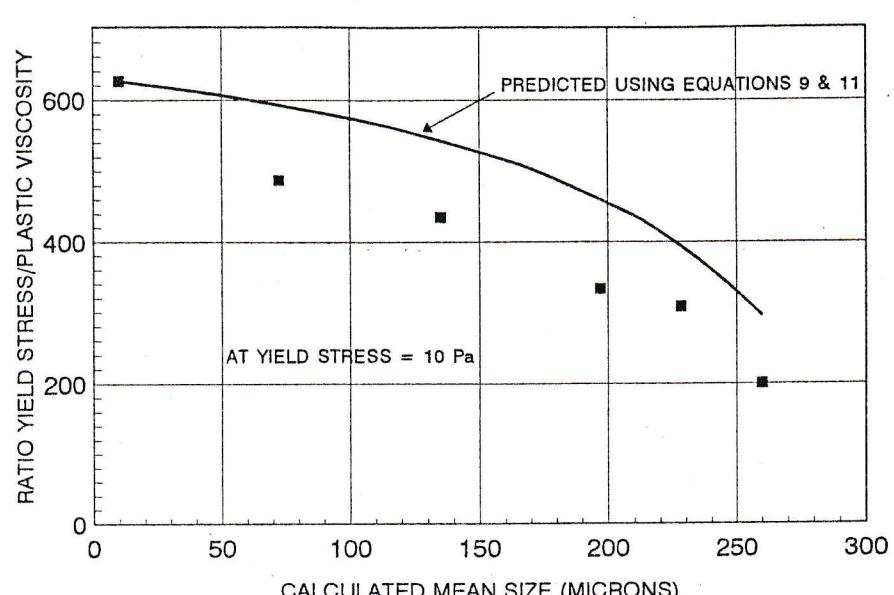
FIGURE 6. RATIO YIELD STRESS / PLASTIC VISCOSITY SERIES 2 TESTS SAND IN SLIMES
SLURRIES HAVING A CONTINUOUS PARTICLE SIZE DISTRIBUTION
The slurries discussed in Section 3 have a "gapped" particle size distribution in that there is little material between the sand sizes and the colloidal sized slimes. The majority of slurries of interest in the mineral processing industries have a more continuous particle size distribution resulting from comminution. In this case it is not so easy to separate them into a coarse sand fraction and a slimes fraction. Nevertheless the rheological behaviour of the continuous size distribution slurries follows similar trends as outlined in Section 3.
Figure 7 shows test results obtained by the author in recent years on 14 different slurries all having continuous size distributions. The plots of Yield Stress versus volume concentration follow similar trends as were indicated in Figure 4 for a sand in slimes "gapped" slurry. These trends are: A decrease in Yield Stress with increasing mean particle size for any particular concentration; and an increase in the slope of the Yield Stress versus concentration plot for increasing mean particle size.
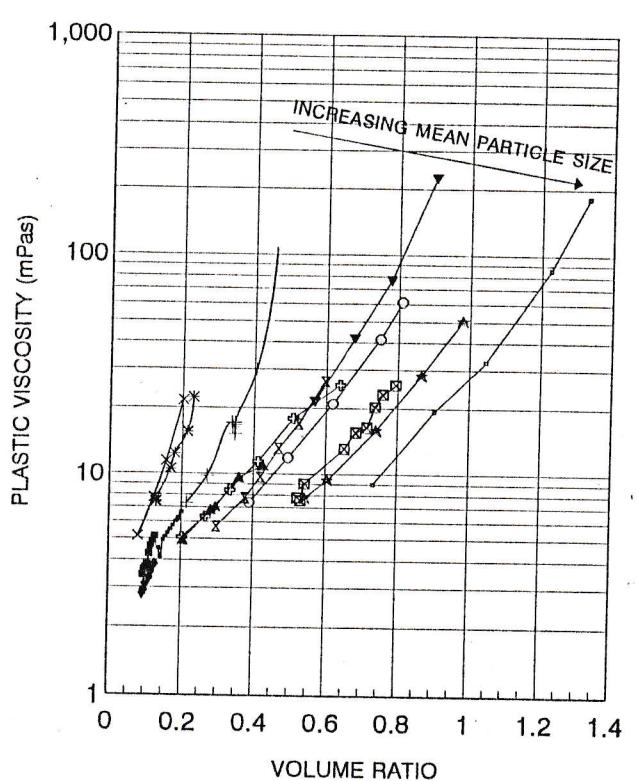
Figure 8 is a plot of Plastic Viscosity versus Volume Ratio for the same 14 slurries. This plot can be compared with Figure 5. Similar trends are evident, namely: The same trend of a decrease in Plastic Viscosity with increasing mean size for any particular concentration is evident in both figures. Also evident is the reduced slope of the plot as the mean particle size increases.
Figure 9 shows a plot of the ratio versus mean particle size for the 14 different slurries. Also included is the ratio for the Series 2 tests which were previously shown in Figure 6. Both sets of data show a reduction in the ratio as the mean particle size increases. However the wide size distribution test results show a stronger decrease in the ratio with mean particle size than the previous "gapped" size Series 2 tests. This is a reflection of the marked differences in particle size distribution of the continuous size distribution slurries and "gapped" size distributions applicable to the Series 2 tests. A more complete analysis would include a distribution parameter to further characterise each slurry in addition to the mean particle size used here.
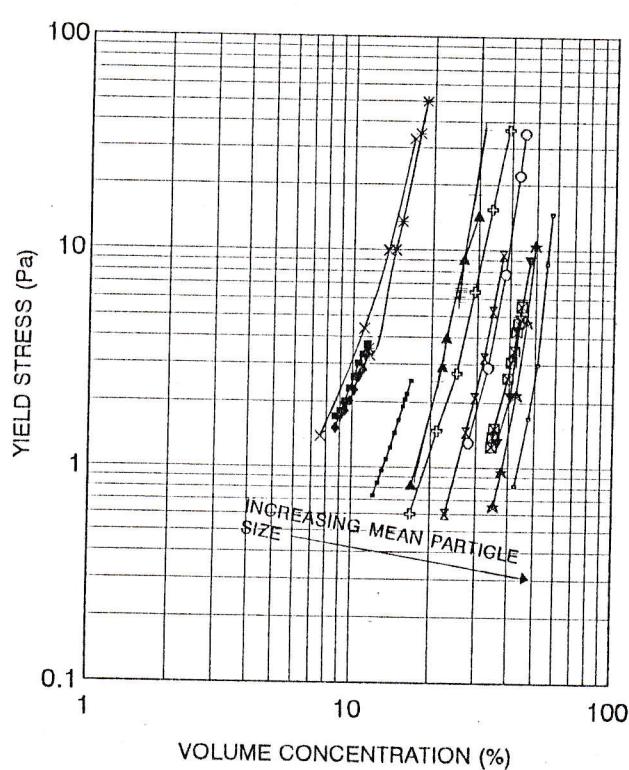
| * ZINC CONC. d80=7.5M | + NICKEL ORE d80=10M | * NICKEL ORE d80=10.1M | * LEAD CONC. d80=16M |
| X NICKEL ORE d80=23M | ♦ LEAD CONC. d80=25M | ★ MAGNETITE d80=35M | X COPPER CONC. d80=47M |
| ○ COPPER TAILS d80=56M | ▼ FLYASH d80=80M | ★ MAGNESITE d80=165M | X SILICA d80=170M |
| ♦ PHOSPHATE d80=220M | - MAGNESITE d80=400M |
FIGURE 7. YIELD STRESS VERSUS VOLUME CONCENTRATION
CONTINUOUS SIZE DISTRIBUTION SLURRIES
FIGURE 8. PLASTIC VISCOSITY VERSUS VOLUME RATIO
CONTINUOUS SIZE DISTRIBUTION SLURRIES
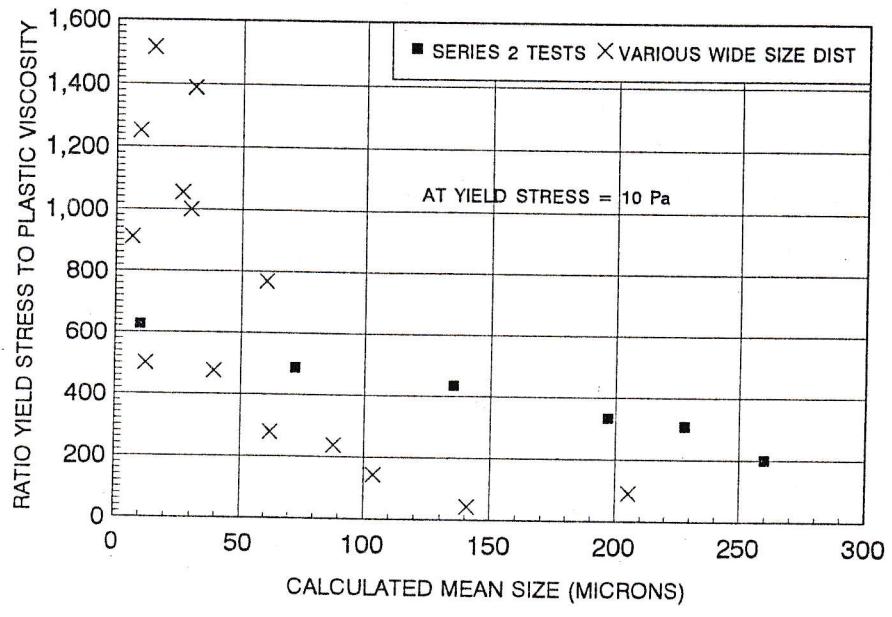
FIGURE 9. RATIO YIELD STRESS/PLASTIC VISCOSITY
SERIES 2 TESTS & WIDE SIZE DISTRIBUTION SLURRIES
CONCLUSIONS
The addition of rigid particles to a Newtonian fluid increases the viscosity. Well known expressions for this effect have been extended to the case of coarse particles added to non-Newtonian Bingham Plastic vehicle slurries. Predicted trends are confirmed by data from the literature as well as data from two series of tests recently completed by the author involving rheology measurements on various sands added to slimes slurries. Direct comparison between predictions and measurements is illustrated by plots of total Yield Stress/ Yield Stress of the slimes versus volume concentration of sand, and total Plastic Viscosity/ Plastic Viscosity of the slimes versus volume ratio of the sand.
The predictive equations have also been recast in terms of total solids concentration and total solids volume ratio with the volume ratio of sand to total solids as parameter. The trends predicted with increasing sand ratio are analogous to the trends observed with more common continuous particle size distribution slurries. In particular the theory predicts the observed increase in slope of the Yield Stress versus volume concentration plot as the mean particle size increases and the reduction in slope of the Plastic Viscosity versus Volume Ratio plot.
The ratio of Yield Stress to Plastic Viscosity is identified as an important parameter which indicates the degree of non-Newtonian behaviour. This ratio decreases as the mean particle size increases.
NOTATION
| A | correlating parameter in eqn 8 |
| B | correlating parameter in eqn 10 |
| C v | fractional volume concentration of solids |
| C vmax | volume concentration at maximum packing |
| C vt | volume concentration of total solids in the slurry |
| d | particle size in metres |
| g | gravitational constant |
| k | correlating parameter in eqns 6, 7, 9 & 10 |
| n | correlating exponent in eqn 8 |
| V r | Volume Ratio which equals C v /(1-C v ) |
| x | volume ratio of sand to total solids |
| Γ | shear rate |
| μ/μ f | ratio of slurry viscosity to fluid viscosity |
| μ p | Plastic Viscosity (Co-efficient of Rigidity) |
| p s | density of the solid particle in kg.m -3 |
| p v | density of the slimes vehicle slurry in kg.m -3 |
| τ | shear stress |
| τ y | Yield Stress |
| τ y (slimes) | Yield Stress of the slimes in Pascals |
REFERENCES
- 1. Macosko, C.W. (1994), Rheology Principals, Measurements and Applications, VCH Publishers Inc., New York.
- 2. Einstein, A. Ann. Phys, 1906, 19, 289
- 3. Thomas, D.G. (1965), J. Colloid Sci., 20, p267
- 4. Landel, R.F., Moser, B.G., and Bauman, A.J. (1963), Fourth Int. Congress on Rheology, Brown Univ., Proc. Part 2, p 663.
- 5. Thomas, A.D. (1978/1), "Coarse Particles in a Heavy Medium - Turbulent Pressure Drop Reduction and Deposition Under Laminar Flow", Hydrotransport 5 Conf., May 8 to 11, Hannover, Paper D5.
- 6. Thomas, A.D. (1979/1), "Pipelining of Coarse Coal as a Stabilized Slurry - Another Viewpoint", 4th Int. Tech Conf. on Slurry Transportation, March 28-30, Las Vegas.
- 7. Thomas, A.D. (1979/2), "The Role of Laminar/Turbulent Transition in Determining the Critical Deposit Velocity and the Operating Pressure Gradient for Long Distance Slurry Pipelines", Hydrotransport 6 Conf., Canterbury, U.K.
- 8. Shook, C.A., Schriek, W., Smith, L.G., Haas, D.B., and Husband, W.H.W. (1973), Experimental Studies on the Transport of Sands in Liquids of Varying Properties in 2 and 4 Inch Pipelines, Report E73-20, Saskatchewan Research Council, Canada.
- 9. Thomas, A.D. (1981), "Slurry Pipeline Rheology", 2nd National Conf. on Rheology, Sydney, May 14.
- 10. Thomas, A.D. (1977), "A Rational Design Philosophy for Long Distance Slurry Pipelines", Chemical Engineering in Australia, The Trans. of the College of Chemical Engineers, Inst. of Engineers, Aust.
- 11. Thomas, A.D. (1978/2), Unpublished work M.D. Research Co. Pty Ltd, Sydney
- 12. Duckworth, R.A., Pullum, L., Lockyear, C.F., and Lenard, J. (1983), Bulk Solids Handling, V3, n4, p817.