This HTML edition contains selectable text extracted from the original PDF. Layout-aware OCR was used to recover reading order, figures and equations; minor recognition errors may remain. Consult the PDF for the authoritative layout, figures and equations.
Influence of additives on energy loss in pipeline flow of flyash mixtures
A. Thomas, Slurry Systems Pty Limited, Australia
J. Sobota, Agricultural University, Poland
Abstract
The mining industry uses wastes such as tailings and flyash to backfill mining voids. Addition of chemicals may be beneficial for two reasons. Firstly to improve flow properties and subsequent placement of the tailings or flyash. Secondly as a means of disposal of chemical wastes which are difficult to store on the surface.
This paper presents the results of pipeloop tests on flyash mixtures with additives of brine and acid. Other pipeloop tests on tailings plus flyash, flyash, and flyash with coarse particles are also presented.
1. INTRODUCTION
Huge quantities of flyash from coal burning power stations are produced throughout the world each year. Some flyash is used in industries such as the cement industry but much must be disposed of. Flyash is generally mixed with water and pumped to a disposal area near the power station, generally as a low density slurry (Wright and Brown (1)) or more recently as a high density slurry (Verkerk (2), Venton et al (3), Heywood et al (4)). The latter reference provides a good summary of previous work on both low and high concentration flyash slurries. Another alternative is to dispose of the flyash in mined out voids, either on the surface from open cut mining, or in disused underground mines.
The flyash can be mixed with other waste materials. Verkerk (5), Bunn (6) and Verkerk and Lorenzato (7) report on flyash and bottom ash mixtures. Moore (8) investigated mixtures of flyash, gypsum and waste water sludge. Chadra et al (9) and Havlik et al (10) studied the flow of flyash and gypsum mixtures.
The present paper reports on pipeloop tests on flyash plus grit or slag from power stations. Flyash slurries often have a high pH and this offers an environmentally attractive means of disposing of acidic wastes from industry by mixing with flyash.
Pipeloop test results for flyash with acidic waste, flyash with brine, and copper tailings with flyash are also reported.
Test data for various slurries are presented to illustrate the pipe flow properties of these slurries. Data used are obtained from tests at the Agricultural University, Wrocław, Poland, and from in-house data of Slurry Systems Pty Limited, Australia. In some cases the results are compared with predictions based on viscometer tests. Table 1 indicates the range of data presented.
Table 1
Summary of Test Loop Data
| Slurry Description | Pipe Size (mm) | Densities (kg/m 3 ) and Combinations Tested | |
|---|---|---|---|
| 1 | Australian flyash | 105 | Densities 1532 & 1584 |
| 2 | Polish flyash | 100 | Densities 1213, 1408 & 1522 |
| 3 | Polish flyash | 207 | Densities 1213, 1408 & 1522 |
| 4 | Polish flyash in brine | 51 | Densities 1254 & 1501 |
| 5 | Australian flyash + furnace ash | 105 |
Flyash 90%, furnace ash 10%
Densities 1454, 1524 & 1574 |
| 6 | Polish flyash plus grit | 51 |
Flyash/Grit 100/0, 90/10, 80/20
Densities 1424, 1536 & 1668 |
| 7 | Polish flyash plus slag | 50 |
0% slag to 12% slag
Densities 1227 to 1365 |
| 8 | Polish tailings plus flyash | 51 |
Tailings/flyash 100/0, 95/5, 85/15
Densities 1610 & 1620 |
| 9 | Polish tailings plus flyash plus acid waste | 51 |
9% ash, 6% acid waste
Densities 1420, 1500 & 1600 |
2. PIPELINE FLOW OF FLYASH SLURRIES
2.1 Illustration of typical flyash slurry behaviour
Figure 1 shows pressure gradient versus velocity data obtained in a 105 mm diameter pipe test loop. The flyash was from an Australian power station. The solids density of the flyash is 2260 kg/m 3 . The particle size is shown in Table 2. The flyash has a top size of 300 microns and d 50 particle size of 17.5 microns. The mean particle size obtained by summing the product of the median size in each size fraction and the fractional mass is 32.4 microns.
Table 2
Flyash particle size
| Particle Size (microns) | 300 | 150 | 106 | 53.5 | 21.5 | 10.1 | 3.0 |
| Cumulative % Passing | 100.0 | 99.2 | 96.6 | 79.5 | 54.4 | 37.7 | 18.6 |
In Figure 1 data are shown for a slurry density of 1584 kg/m 3 (66.1% concentration by weight) and 1532 kg/m 3 (62.3% concentration). Rheology data at these two concentrations were obtained using a Contraves Rheomat 115 rotational viscometer at shear rates between 56 and 661 s -1 . Over this shear rate range the data closely
followed a straight line on a linear plot and were therefore fitted by a Bingham Plastic model with the resulting Bingham parameters given in Table 3.
The lowest pressure gradient measured in Figure 1 is 180 Pa/m representing a wall shear stress of 4.7 Pa. This shear stress is within the shear stress range tested in the viscometer so the Bingham plastic model is judged suitable for predictive purposes.
Table 3
Flyash slurry Bingham Plastic parameters
|
Concentration
(Wt%) |
Slurry Density
(kg/m 3 ) |
Yield Stress
(Pa) |
Plastic Viscosity
(mPas) |
|---|---|---|---|
| 66.1 | 1584 | 2.69 | 46.5 |
| 62.7 | 1532 | 1.77 | 22.6 |
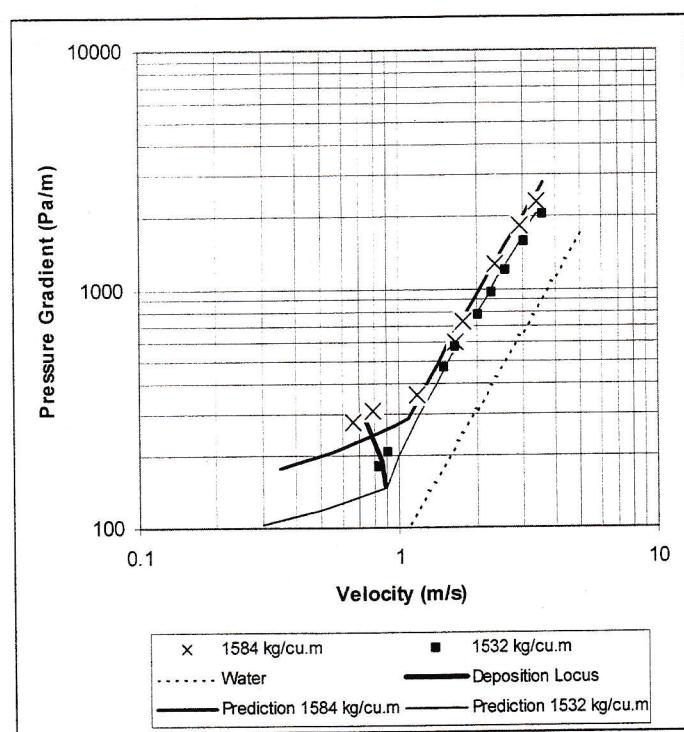
Figure 1 Flyash slurry in 105 mm pipe
The lower dashed line in Figure 1 is for water. The two full lines through the two sets of slurry data represent predictions assuming homogeneous flow. Turbulent flow predictions use the method of Wilson and Thomas (11) and laminar flow predictions are based on the Buckingham equation (12). Transition between laminar and turbulent flow is assumed to occur at the intersection of the two curves. The test loop included a transparent viewing spool through which a stationary bed of solids could be seen at
low velocities. The thick, near-vertical line in the low velocity region of Figure 1, represents the locus of incipient stationary deposition.
Consider the lower density data in Figure 1. The predicted curve fits the turbulent flow data reasonably well at moderate velocities but there is about 10% over prediction at high velocities. The predicted transition to laminar flow at 0.90 m/s approximately coincides with the observed deposition velocity of 0.87 m/s. However at lower concentrations, down to 44%, for which the laminar-turbulent transition velocity was very much lower, the observed deposition velocity was still around 0.80 m/s. This suggests that at a density of deposition is marginally influenced by transition to laminar flow.
The higher density data in Figure 1 are predicted reasonably well in the turbulent regime. Laminar-turbulent transition is predicted to occur at 1.1 m/s. The three lowest velocity data points suggest possible transition around 1.3 m/s with the data below this velocity appearing to parallel the predicted laminar flow curve. However the higher than predicted pressure gradient in the laminar flow region could also be due to heterogeneous effects in the laminar regime. At velocities below transition there are no turbulent eddies to support the coarsest particles and there is some sliding bed type behaviour with the attendant increased pressure gradient. Deposition was observed under laminar flow conditions at 0.73 m/s.
The flyash slurry behaviour illustrated in Figure 1 is typical of flyash flow behaviour. At low concentrations, at velocities above about 1 m/s, homogeneous type flow behaviour occurs with the slurry curve essentially paralleling the water curve on a logarithmic plot. Deposition, which occurs at around 0.8 m/s in the 105 mm diameter pipe, will occur at higher velocities as the pipe size is increased. However as predicted by Thomas (13), the deposit velocity for this fine particle slurry should only increase approximately as , where is the pipe diameter.
As the concentration is increased eventually the laminar-turbulent transition velocity rises above 1 m/s and laminar flow effects start to influence flow behaviour. Once laminar flow occurs the pressure gradient rises above that expected for homogeneous turbulent flow as illustrated in Figure 1. The increased pressure gradient is due not only to pure laminar flow behaviour but also due to increased sliding behaviour in the absence of turbulent support. Predictions of laminar flow behaviour of flyash slurries at high concentrations is not yet fully defined. As outlined first by Thomas (14) the pressure gradient and deposition velocity under laminar flow conditions depend on pipe size. Laminar flow at a particular velocity in one pipe size does not guarantee that laminar flow without deposition can be achieved with the same slurry in a larger pipe size. Pipeline length is also a factor. Under laminar flow operation slow settling of coarser particles with distance along a pipeline will result in a slow increase in pressure gradient as discussed by Aude et al (15). For these reasons high concentration flyash pipelines such as the Bayswater pipeline in Australia (Venton et al (3)) are designed to operate in the turbulent flow regime.
2.2 Additional flyash data
Many different flyash mixtures have been tested at the Agricultural University, Wroclaw, e.g. Sobota and Jodlowski (16), Sobota and Czaban (17), and Sobota et al (18). Figure 2 shows test loop data for a Polish flyash in a 100 mm diameter pipe.
The behaviour is similar to that measured with the Australian flyash in Figure 1 in a similar sized pipe. The highest density data in Figure 2 ( ) is of similar density as the lowest density ( ) in Figure 1 and their behaviour is similar.
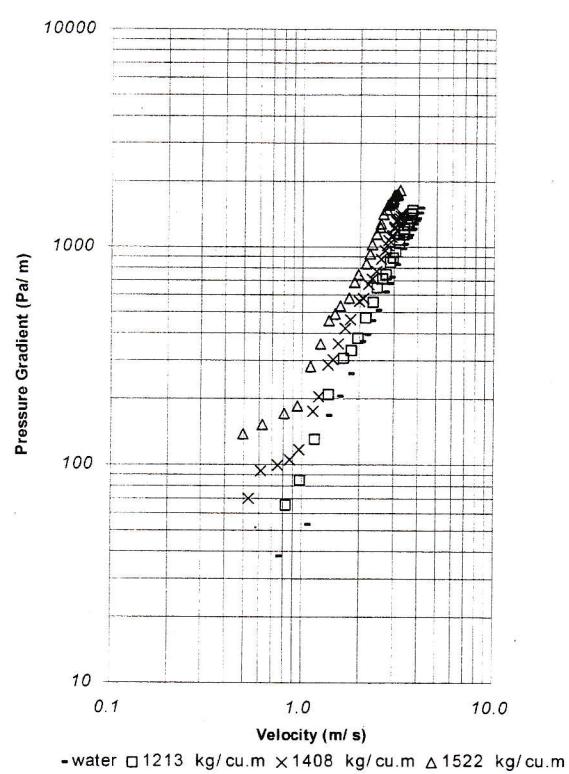
Figure 2 Flyash slurry in 100 mm pipe
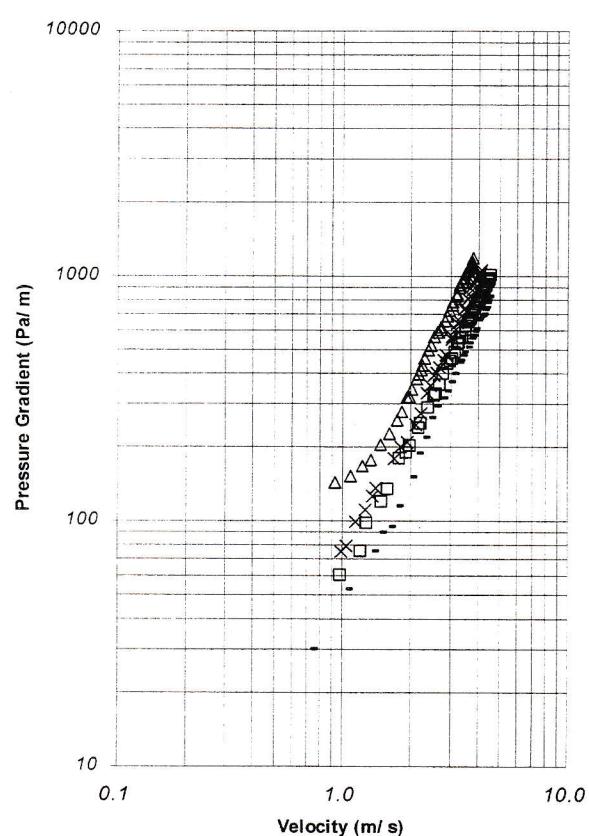
For example at a velocity of 2 m/s Figure 2 indicates a pressure gradient around 750 Pa/m compared with about 780 Pa/m in Figure 1. At 1 m/s the pressure gradient is around 200 Pa/m in both figures. Laminar-turbulent transition is indicated around 1 m/s in Figure 2, similar to the 0.9 m/s predicted in Figure 1. Figure 3 shows test loop data for the same Polish flyash in a 207 mm diameter pipe.
At the two lowest densities the data show no evidence of deposition at velocities down to 1 m/s. This is consistent with the comments above regarding deposition under turbulent flow conditions. At first sight the highest density data suggest laminar-turbulent transition at around 1.3 m/s. However the transition velocity for this density slurry was around 1 m/s in the smaller 100 mm diameter pipe. The transition velocity should not vary much between these two pipe sizes. It is more likely that the change in behaviour evident below 1.3 m/s in Figure 3 reflects increased heterogeneous behaviour as laminar-turbulent transition influences begin to prevail.
- water 1213 kg/cu.m 1408 kg/cu.m 1522 kg/cu.m
Figure 3 Flyash slurry in 207 mm pipe
The pressure gradient at 2 m/s for the highest density slurry (1522 kg/m 3 ) in Figure 3 is around 330 Pa/m. This is reasonably consistent with the 360 Pa/m reported by Venton et al (3) in the 200 mm diameter Bayswater high density ash pipeline in New South Wales, Australia, for a somewhat higher density (1640 kg/m 3 ) 69.7% concentration flyash slurry.
Thus comparisons between Figures 1, 2 and 3 and data from Venton et al (3) indicate that the pressure gradient in the turbulent regime is similar for these flyash slurries from Australia and Poland. Also, at low densities the deposit velocity under turbulent flow conditions is less than 1 m/s, as expected.
3. FLYASH IN BRINE
Saline water is often present in Polish coal and copper mines. Discharge of the water into rivers is undesirable. If a power station is nearby the brine and flyash can be
mixed and disposed underground. This solves the problem of river pollution, overcomes the need for surface ash dams, and strengthens the underground voids.
Data obtained in a 51.2 mm diameter test loop with mixtures of brine plus flyash are presented in Figure 4. The brine contains 70 g NaCl per litre and has a density of 1021 kg/m 3 . The two slurry densities shown represent flyash to brine ratios of 0.5:1 and 1.5:1 and volume concentrations of 0.188 and 0.366.
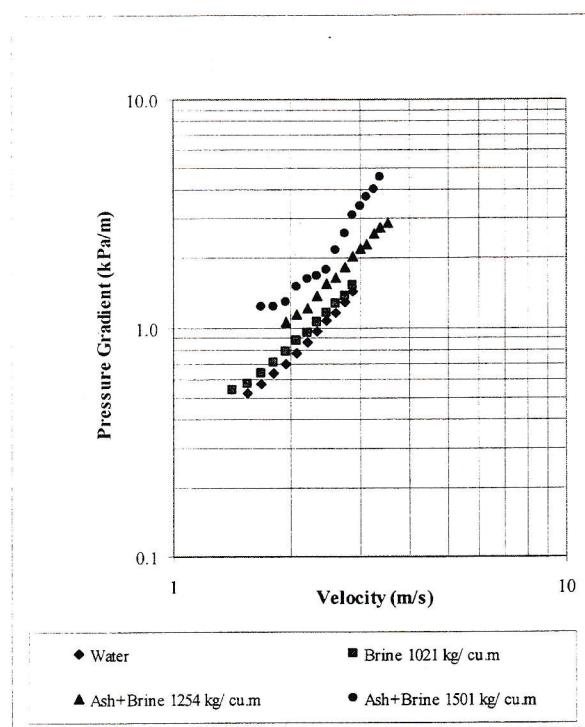
Figure 4 Flyash in brine in 51.2 mm pipe
The flyash has a solids density of 2367 kg/m 3 . The particle size is summarised in Table 4.
Table 4
Flyash particle size
| Particle Size (Microns) | 1000 | 250 | 100 | 50 | 20 | 6 |
| Cumulative % Passing | 100 | 96 | 85 | 68 | 18 | 2 |
The data for the highest density mixture (1501 kg/m 3 , volume concentration 0.366) suggests a flattening curve for velocities below 2 m/s. This could indicate either transition to laminar flow or heterogeneous behaviour. Neither of these is expected. A transition velocity of 2 m/s is higher than the expected 1 m/s from previous Section 2
observations. The viscosity of the brine is only about 1.5 times that of water so it should not increase the transition to this degree. Also heterogeneous behaviour would not be expected in this size pipe at around 2 m/s for this particle size flyash.
4. FLYASH WITH COARSE PARTICLE ADDITION
4.1 Flyash plus furnace ash
Furnace or bottom ash is generally disposed separately to flyash. One alternative is to add the coarser furnace ash to the flyash slurry for co-disposal. Tests were conducted in a 105 mm diameter test loop on a mixture of 90% flyash with 10% crushed furnace ash. The flyash has properties previously summarised in Tables 1 and 2. The particle size of the furnace ash is given in Table 5.
Table 5
Furnace ash particle size
| Particle Size (mm) | 5.56 | 2.36 | 0.60 | 0.30 | 0.18 | 0.106 | 0.045 |
| Cumulative % Passing | 99.82 | 98.62 | 96.72 | 93.82 | 85.62 | 60.82 | 16.92 |
The solids density of the furnace ash was giving an overall mixture solids density of . Rheology of the mixture is summarised in Table 6.
Table 6
Flyash plus furnace ash slurry Bingham Plastic parameters
| Concentration (Wt%) | Slurry Density ( ) | Yield Stress (Pa) | Plastic Viscosity (mPas) |
|---|---|---|---|
| 65.27 | 1574 | 1.98 | 56.0 |
| 61.48 | 1524 | 0.99 | 23.4 |
| 55.87 | 1454 | 0.41 | 11.2 |
Figure 5 shows plots of pressure gradient versus velocity for the three mixture densities. As previously in Figure 1 the three full lines represent homogeneous fluid predictions. In Figure 5 the turbulent flow behaviour of all three slurries is predicted quite well. For the highest density slurry laminar-turbulent transition is predicted to occur at around 1 m/s and the data support this. The measured pressure gradient in the laminar flow region is about 15% higher than predicted but the data follow the predicted slope. Deposition was observed under laminar flow conditions below 0.7 m/s.
For the slurry the predicted transition velocity is 0.66 m/s. However deposition was observed under turbulent flow conditions at 0.8 m/s and laminar flow was not obtainable. Similarly for the lowest density slurry transition is predicted at 0.43 m/s but laminar flow was not obtainable, with deposition observed under turbulent flow conditions at 0.85 m/s.
Comparisons between results for flyash alone (Figure 1) and flyash plus 10% furnace ash (Figure 5) indicate similar behaviour. This is not surprising given the low
proportion of furnace ash in the mixture and the relatively small percentage (6.18%) of the furnace ash which is coarser than the 300 micron top size of the flyash.
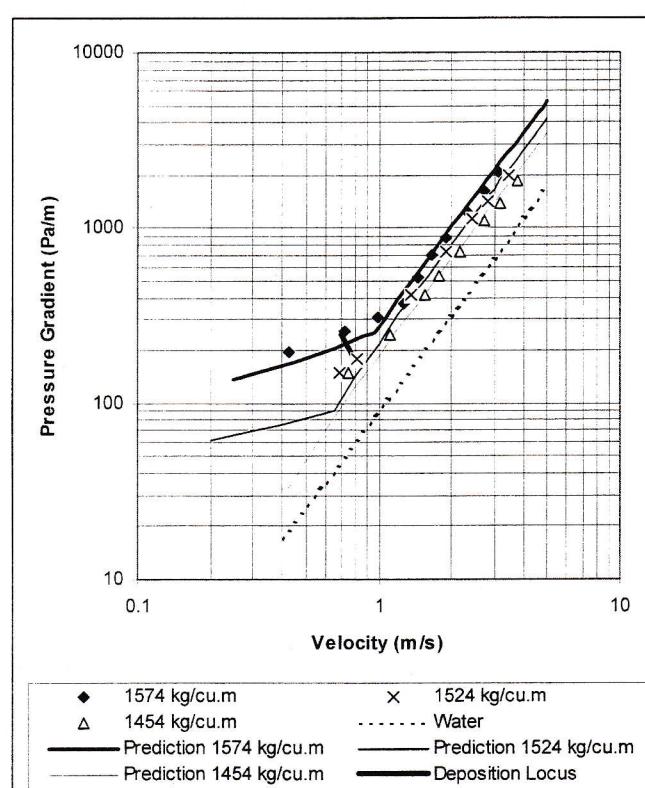
Figure 5 Flyash plus crushed furnace ash in 105 mm pipe
4.2 Flyash plus grit
Figure 6 shows pressure gradient data obtained in a 51.2 mm diameter test loop for flyash alone and flyash with 10% and 20% grit component. The grit is crushed reject rock from a coal mine and has a particle size from 2 to 5 mm. Solids densities are for the flyash and for the grit. The particle size of flyash is summarised in Table 7.
Table 7
Particle size of flyash
| Particle Size (microns) | 250 | 100 | 50 | 20 | 6 | 2 |
| Cumulative % Passing | 100 | 74 | 70 | 9 | 8 | 6 |
The three sets of data each appear to indicate turbulent flow at high velocities and laminar flow at low velocities. The transition velocities deduced from the plot are
around 1.6 m/s for the flyash alone, around 1.8 m/s for the 10% grit mixture and around 2.5 m/s for the 20% grit mixture. Of course, the fact that laminar flow was obtained in the 51.2 mm diameter pipe, does not necessarily mean that laminar flow could be obtained in larger size pipes, as explained by Thomas (14).
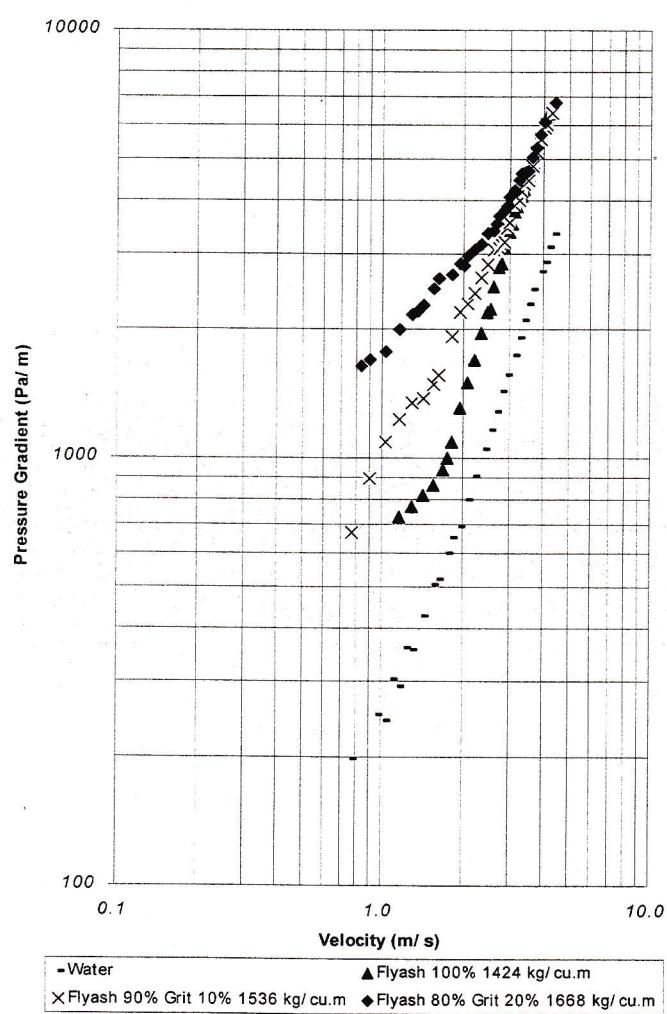
Figure 6 Flyash plus Grit in 51.2 mm Pipe
4.3 Flyash plus slag
Figure 7 shows pressure gradient data obtained in a 51.2 mm diameter test loop for flyash alone and flyash plus slag. The slag comes from a power station and has a maximum particle size of 3 mm and solids density of . The particle size of the flyash is summarised in Table 8. No details of the particle size below 60 microns is available. Deposition was observed at the lowest velocity for each density.
Table 8
Particle size of flyash
| Particle Size (microns) | 500 | 250 | 120 | 80 | 60 |
| Cumulative % Passing | 99.9 | 99.7 | 94.1 | 85.9 | 75.2 |
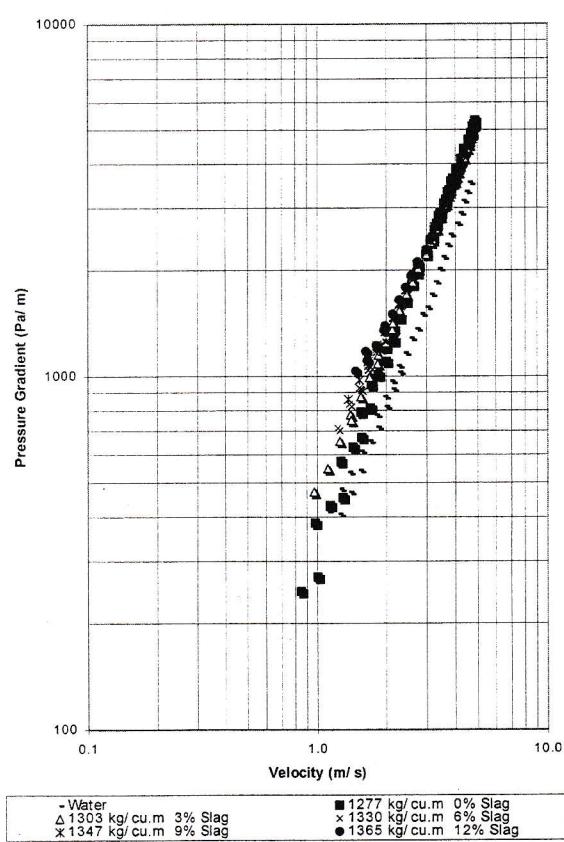
Figure 7 Flyash plus Slag in 50 mm Pipe
5. FLYASH pH EFFECTS
When water is added to dry flyash the resulting slurry exhibits a pH value determined by the chemical nature of the flyash and water. The resulting slurry pH can vary widely between flyash slurries from different sources.
Tests on an Australian flyash resulting from burning low rank coal indicated an initial low slurry pH immediately after water addition of around pH 2.5. The slurry pH increased slightly with time reaching a pH around 3.75 after 24 hours. This slight increase in pH is accompanied by an increase in viscosity. For example the yield
stress of a 70% concentration slurry sample increased by about 50% from 5.5 Pa to 8.7 Pa. The plastic viscosity increased 2.5 times from 79 mPas to 202 mPas.
Lime is added to this flyash slurry prior to disposal to achieve a neutral pH. Addition of lime causes an additional increase in viscosity. For example the yield stress of another 70% concentration flyash mixture increased from 4.9 Pa to 13.3 Pa after lime was added to raise the pH to 7.3. The plastic viscosity increased marginally from 93 mPas to 113 mPas.
In contrast to the Australian flyash discussed above, another Australian flyash from Bayswater power station, exhibits a pH of around pH 5 immediately after water addition but the pH then increases rapidly to around pH 11 after about 2 hours with a subsequent slower increase to pH 12 after about 16 hours and beyond (Venton et al (3)). During the first 2 hours there is little change in rheology but thereafter the viscosity increases significantly. For example for a 72% concentration flyash slurry the yield stress increased from 5 Pa after 2 hours to 13 Pa after 48 hours. During the same period the plastic viscosity increased tenfold from 100 mPas to 1000 mPas.
6. TAILINGS PLUS FLYASH MIXTURES
6.1 Tailings plus Ash
Mine tailings may be mixed with flyash to assist disposal. Figure 8 shows test results obtained in a 51.2 mm diameter test loop with mixtures of tailings from a copper mine and flyash.
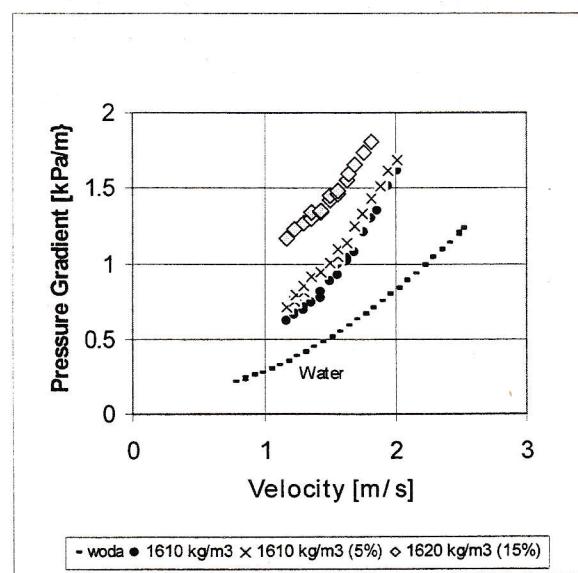
Figure 8 Tailings plus Flyash (5% and 15%) in 51.2 mm Pipe
Data are shown for tailings alone, tailings plus 5% flyash, and tailings plus 15% flyash, all at approximately the same density. Solids density of the tailings and flyash are and respectively. The particle size of the tailings and ash are summarised in Table 9.
Table 9
Particle size of tailings and ash
| Particle Size (microns) | 1000 | 500 | 250 | 100 | 50 | 20 | 6 | 2 |
|---|---|---|---|---|---|---|---|---|
| Cumulative % Passing | ||||||||
| Flyash | 100 | 96 | 87 | 67 | 50 | 15 | 5 | 2 |
| Tailings | 100 | 100 | 99 | 85 | 50 | 28 | 16 | 10 |
Increasing the proportion of coarser flyash results in a higher pressure gradient. The total solids concentrations of the three slurries are similar, ranging from 59.4% for the tailings alone to 60.9% with 15% flyash. For any given total concentration the viscosity will decrease with a greater proportion of coarse particles, see Thomas (19), and yet Figure 8 indicates a significant increase in pressure gradient with 15% flyash. This higher pressure gradient is unlikely to be due to increased heterogeneity since the flyash is not particularly coarse. The most likely explanation is that flyash addition alters the tailings pH causing an increased viscosity.
6.2 Tailings plus ash plus acid waste
Disposal of acid wastes from industry is a problem. One solution is to add the waste to mine tailings with flyash added to raise the pH to a neutral level. Figure 9 shows results obtained in a 51.2 mm diameter test loop for a slurry consisting of tailings mixed with 9% ash plus 6% acid waste at three different slurry densities.
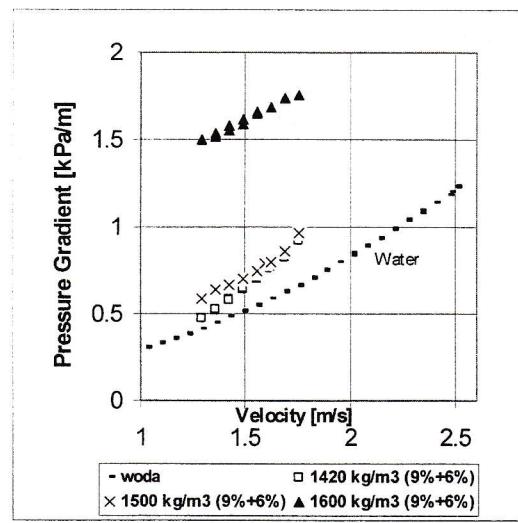
Figure 9 Tailings plus 9% Ash plus 6% Acid Waste in 51.2 mm Pipe
The tailings and ash are the same as discussed in Section 6.1. Increasing the density from 1500 to 1600 kg/m 3 results in a large increase in the pressure gradient. This must be due to the viscosity increasing sufficiently to result in laminar flow since this increase in density would only result in a moderate increase in pressure gradient if turbulent flow prevailed.
7. CONCLUSIONS
Disposal of flyash from coal burning power stations is an environmental problem throughout the world. Disposal into mined out voids, left over from either open cut mining or underground mining, offers an attractive solution. Addition of other wastes to the flyash slurry can solve two disposal problems together.
This paper has shown that the pipeflow behaviour of the tested flyash slurries from Australia and Poland are similar. The laminar-turbulent transition velocity rises above 1 m/s once the slurry density approaches 1500 kg/m 3 . The turbulent flow pressure gradient is predicted adequately by Wilson and Thomas (11) based on the Bingham Plastic parameters determined in a rotational viscometer. The laminar flow pressure gradient is generally higher than predicted by the Buckingham (12) equation. This is most likely due to heterogeneous effects which, as discussed by Thomas (13), will have increasingly greater influence as the pipe size is increased.
Slurries composed of flyash in brine exhibit similar behaviour but with a higher transition velocity around 2 m/s at 1500 kg/m 3 density.
Flyash-water mixture is a good carrier liquid for grit above 3.5 m/s velocity in a 50 mm pipe and for a slag above 3 m/s velocity because a pressure gradient is the same as for flyash-water mixture. In Polish mine backfilling installations a velocity of order 3 or 3.5 m/s is low. Addition of 15% flyash to tailings increases the pressure gradient by about 100%.
Disposed mine tailings can be made more environmentally benign by adding flyash. In particular flyash can be used to neutralise the pH of acidic wastes. Pipe flow data for these materials are given.
8. REFERENCES
- 1. Wright, D. and Brown, J., Hydraulic disposal of p.f. ash from C.E.G.B. Midland region power stations, Proc. Hydrotransport 6, 1979, pp 379-388.
- 2. Verkerk, C.G. Transport of flyash slurries, Proc. Hydrotransport 8, 1982, pp 307-316.
- 3. Venton, P.B., Wortley, M.G., and Ward, P. The Bayswater high density fly ash disposal system, Proc. Hydrotransport 13, 1996, pp435-452.
- 4. Heywood, N.I., Mehta, K.B., Poplar, D. and Moore, C.D. Assessment of Flow Characteristics of Pulverised Fuel Slurries at High Concentration, Proc. Hydrotransport 12, Brugge, Belgium, Sept 1993, pp353-376.
- 5. Verkerk, C.G., The transport of flyash and bottom ash in a slurry form, Mech. Eng. Trans, ME12(3), 1987, pp122-128.
- 6. Bunn, T.F. Dense phase hydraulic conveying of power station flyash and bottom ash, Proc. 3 rd Intl Conf. on Bulk Materials, Storage, Handling and Transportation, June 1989, Newcastle, Australia, pp 250-255.
- 7. Verkerk, C.G. and Lorenzato, A. The mixed regime PFA and BBA slurry disposal system at Malta power station, Proc. Hydrotransport 12, Sept 1993, Brugge, Belgium.
- 8. Moore, C.D. An analysis of hydraulic transportation of power station residues to disposal sites, Proc. 3 rd Int Conf on Desulphurisation, I. Chem. E, Rugby, U.K., March 1993.
- 9. Chadra, Z., Severa, M., Vlasak, P, Havlik, V, Vyital, J. Flow of dense kaolin and ash slurries, Proc. Hydrotransport 13, Sept 1996, Johannesburg, South Africa.
- 10. Havlik, V, Vesela, J., Chara, Z, and Vlasak, P. Hydraulic transport and disposal of ash-gypsum slurries, Proc. Hydrotransport 13, Sept 1996, Johannesburg, South Africa.
- 11. Wilson, K.C. and Thomas, A.D. A new analysis of the turbulent flow of non-Newtonian fluids, Can. Jnl Chem. Engng, Vol 63, Aug 1985, pp 539-546.
- 12. Buckingham, E., A.S.T.M. Proc., Vol 21, 1921, p 1154.
- 13. Thomas, A.D., Predicting the deposit velocity for horizontal turbulent pipe flow of slurries, Int. J Multiphase Flow, Vol. 5, 1979, pp 113-129.
- 14. Thomas, A.D., Pipelining of coarse coal as a stabilized slurry-another viewpoint, Proc. 4 th Int. Tech. Conf. on Slurry Transportation, Las Vegas, 1979, pp 196-205.
- 15. Aude, T.C., Derammelaere, R.H., and Wasp, E.J., Instability of laminar flow in long distance pipelines and solutions, 21 st Int Tech Conf. on Coal Utilization & Fuel Systems, March 1996, Clearwater, Florida.
- 16. Sobota, J., Jodlowski, P., The studies of the global and local characteristics of water-ash mixture flow in horizontal pipe, Archiwum Hydrotechniki, tom XXXIV, zeszyt 3-4, 1987, pp.277-284. (in Polish).
- 17. Sobota, J., Czaban, S., Hydraulic Transportation of Fly-Ash in Newtonian and non-Newtonian Zone, Siebentes internationales Kolloquium uber Hydromechanisierung im Bergbau und im Bauwesen, 4-6.09.1991, Varna, Bulgarien (in Russian).
- 18. Sobota, J., Plewa, F, Global and local characteristics of ash mixture flows, Electronic Journal of Polish Agricultural Universities, Environmental Development, Volume 3, Issue 2, 2000.
- 19. Thomas, A.D. The influence of coarse particles on the rheology of fine particle slurries, Proceedings Rheology in the Mineral Industry Conf., Hawaii, March 1999, United Engineering Foundation, N.Y.