This HTML edition contains selectable text extracted from the original PDF. Layout-aware OCR was used to recover reading order, figures and equations; minor recognition errors may remain. Consult the PDF for the authoritative layout, figures and equations.
Two 300km concentrate pipelines compared. Century Zinc/Lead concentrate pipeline, Australia and Antamina Copper/Zinc concentrate pipeline, Peru
A.D. Thomas, Slurry Systems Pty Limited, Australia
P. Gaultier, Compania Minera Antamina, Peru
M. Hoskins, Pasminco Century Mine Ltd, Australia
Abstract
This paper compares hydraulic design and operational aspects of the Century Zinc/Lead concentrate pipeline and the Antamina Copper/Zinc concentrate pipeline. System comparisons include route profile, hydraulic gradient, pump pressures, and restart times. Density variations at the head and tail of a batch and the parameters which influence these quantities are compared. The effect of an extended shutdown on batch density variations is examined. Trailout of solids at the tail of a batch, the factors that influence the extent of this trailout, and batch contamination issues are discussed. The paper is based on information obtained during commissioning of each pipeline together with more recent operating data.
1. INTRODUCTION
The Pasminco Century zinc/lead concentrate pipeline in North Australia was commissioned in November 1999. The hydraulic design was by Slurry Systems Pty Limited with detailed design by Joint Venture commissioned on zinc concentrate by a team comprising Bechtel Bechtel. The pipeline was commissioned on zinc concentrate by a team comprising Bechtel representatives and the principal author of this paper. The pipeline was subsequently commissioned on lead concentrate in July 2000.
The Antamina copper/zinc concentrate pipeline in Peru was commissioned in June 2001. The hydraulic and detailed design of the Antamina pipeline was by Pipeline Systems Incorporated (PSI) with design overview by Ed Wasp of STI International. Construction was by Bechtel with specialist supervision by PSI. Pipeline commissioning utilised a team of PSI specialists managed by the principal author of this paper acting as Antamina's Pipeline Commissioning Manager.
These two pipelines have a number of similarities. They are both approximately 300 kms long (Century 304 kms, Antamina 301 kms), the operating flow rates are around 300 cu.m/h, each has a single pump station, and they both involve batching of different concentrates separated by water batches. Both pipelines are constructed with an internal liner of High Density Polyethylene (HDPE). However the two route profiles are markedly different.
Each pipeline also represents a world's first in some aspects. Compared to other concentrate pipelines the Century pipeline transports the longest concentrate pipeline at the lowest velocity (1.2 m/s), and is the longest single pump station concentrate pipeline in the world. Century was also the first pipeline designed to transport different concentrates in separate batches. The Antamina pipeline has the highest pump discharge pressure (25 MPa) of any concentrate pipeline and the most number of choke stations and shutdown valve stations.
2. SYSTEM DESCRIPTIONS AND SLURRY PROPERTIES
2.1 System descriptions
The Century pipeline has a single pump station with three Wirth TPM 83/4 x 14 piston diaphragm type pumps each driven by a 1130 kW motor. There are two pressure monitoring stations along the pipeline to provide HGL information and leak detection monitoring, and a single (duplicated) terminal shutdown valve. The pipeline is 323.9 mm OD with steel wall thickness varying from 8.4 mm to 4.8 mm, lined with 7.5 mm of HDPE.
The Antamina pipeline has a single pump station with four Wirth TPK2200 7½"x 14" piston pumps each driven by a 1305 kW motor. There are four pressure monitoring stations along the route to provide HGL information, slack flow monitoring and leak detection monitoring. There are four intermediate valve stations at Km 125, Km 143, Km 162 and Km 177 as well as a terminal valve station. During pipeline shutdown, valves are closed at the five valve stations to distribute the shutdown static pressures. The valve stations at Km 125 and Km 162 and at the terminal include variable choke banks to dissipate head during pipeline flow. The pipeline OD varies as follows: 0 to 124.6 km, OD 273.1 mm; 124.6 to 177.3 km, OD 219.1 mm; 177.3 to 213.4 km, OD 244.6 mm; 213.4 to 301.3 km, OD 273.1 mm. Steel pipe wall thickness varies to suit pressure requirements ranging from 11.1 mm to 6.35 mm. HDPE liner thickness also varies ranging from 11.9 mm to 7.1 mm.
2.2 Slurry Properties
Table 1 compares the slurry properties of the two pipelines.
Table 1
Century and Antamina pipelines - typical slurry properties
3. ROUTE PROFILE AND HYDRAULIC GRADIENT
The Century pipeline has perhaps the flattest profile of any slurry pipeline, commencing at an elevation of 155 m and ending at an elevation of 15 m, with an average profile gradient of 0.47 m/km. In contrast the Antamina mine is one of the highest in the world with the pipeline commencing at an elevation of 4155 m, rising to a peak elevation of 4669 m and terminating at an elevation of 50 m, with an average profile gradient of 13.6 m/km. The Antamina pipeline involves three choke stations to dissipate the excess head and five valve stations to distribute pressure on shutdown. In contrast the Century pipeline has only a terminal shutdown valve.
Figure 1 allows comparison between the two route profiles and Hydraulic Gradient Lines (HGL's). Although both pipelines are constructed with a maximum 16% pipeline slope at any location, typically under creeks and rivers, the maximum general slope of the Century pipeline is much less, being at an example only 2.35 m/km over the first 20 kms "steepest" section. In contrast the Antamina pipeline has uphill and downhill slopes around 40 m/km over much of its length.
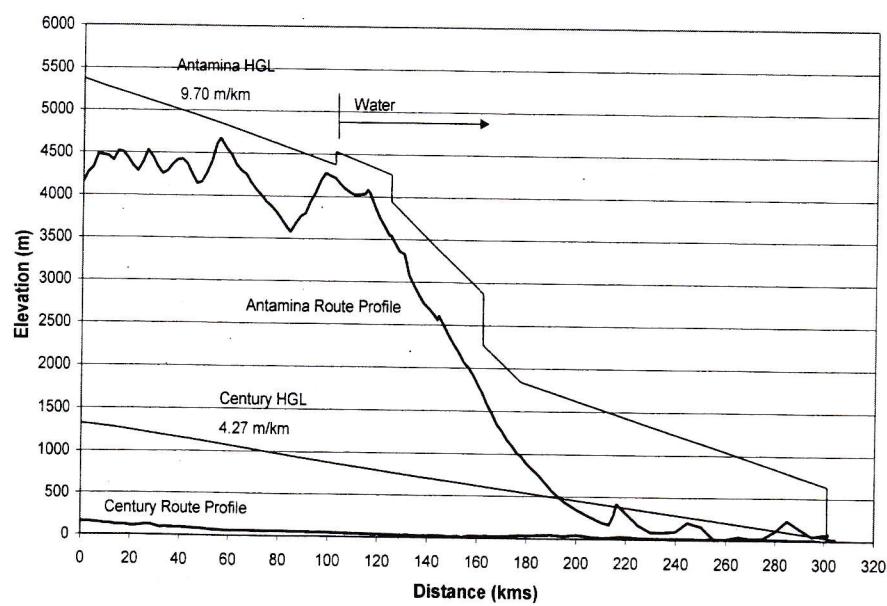
Figure 1 Comparison Century and Antamina route profiles and HGL's
The HGL shown for Century represents the design HGL with the pipeline completely filled with zinc concentrate at a concentration of 37% wt/wt and at an operating flow rate of 304 m 3 /h. The average gradient is 4.27 metres of slurry per km and the pump station discharge head of 1166 m equates to 15.8 MPa discharge pressure. In practice four to six hour batches of zinc concentrate separated by half hour batches of water are generally pumped, with typical discharge pressures around 11 MPa at a flow rate of 290 m 3 /h.
The HGL shown for Antamina was measured during pipeline commissioning with the initial 105 kms completely filled with copper concentrate at 64.8% wt/wt concentration at a flow rate of . The remainder of the pipeline was filled with water. The pump pressure required for this situation is the same as that required if the pipeline was completely filled with slurry since the extrapolated initial HGL clears the last high point at Km 115 and flow is by gravity beyond that point. As shown, the choke stations at Km 125, Km 162 and at the terminal were configured in this instance to dissipate 314 m, 599 m, and 558 m of water head respectively. The pump station discharge head of 1214 m equates to 23.6 MPa discharge pressure.
In Figure 1 the average head gradient in the Antamina pipeline between the pump station and Km 98 is 9.70 m/km or 189 kPa/km. This compares with the average head gradient for the Century pipeline of 4.27 m/km or 57.8 kPa/km. Comparing the two pipelines shows that if the Antamina pressure gradient of 189 kPa/km was to apply to the Century pipeline the required total pump pressure would be around 55 MPa requiring at least two and possibly three pump stations. The reason why only one pump station is required at Century is primarily because of the extremely fine particle size. The fine particle size meant the operating velocity could be reduced to only 1.2 m/s. The fine particle size and attendant high rheology also meant that the pumping concentration had to be reduced to 37% to maintain turbulent flow. This in turn means that the slurry SG is relatively low. The low operating velocity combined with the low slurry SG are the main reasons why the Century pipeline requires only one pump station. Of course, in spite of the higher pressure gradient the Antamina pipeline only requires one pump station because gravity flow prevails over two thirds of the pipeline length.
4. INTERFACIAL MIXING AND TRAILOUT FROM BATCHES
4.1 Batching programs
The Century and Antamina pipelines transport batches of different concentrates separated by water batches. Current Century operations utilise a one hour water batch in front and a two hour water batch behind each lead concentrate batch. Water batches of varying length are also inserted between zinc concentrate batches primarily to match pipeline capacity with production with the aim of keeping the pipeline operating continuously. Current Antamina operations utilise a two hour water batch behind each batch required to be separated from the following batch. Similar concentrate batches are linked without water separation or with sufficient water to match thickener output. Water batches of 4-8 hours are avoided to ensure protection by the rupture disk at Valve Station 1 due to route profile considerations.
Turbulent mixing at the front and end of a slurry batch together with the degree of trailout of coarser particles at the end of a batch determine the water batch lengths required to minimise contamination between batches of different concentrates. Mixing and trailout lengths are generally increased if the pipeline is shutdown and restarted and this is a major reason why continuous pipeline operation is preferred at both Century and Antamina. To minimise contamination between different batches it is important to be able to predict both the interfacial mixing at the head of a batch and especially the trailout of solids at the rear of a batch.
4.2 Interfacial mixing at head of continuously flowing batch
Even with homogeneous fluids, interfacial mixing occurs at the batch interface and knowledge of this mixing length is extensively used in batching products in oil pipelines. Smith and Shulze (1) predict the time required to reach 99% purity in terms of pipeline length and the Reynolds Number based on the average fluid properties of the two batches.
Figure 2 shows the increase in concentration entering the terminal versus time. To allow comparisons between the different tests having differing batch concentrations, e.g. Antamina copper concentrate at 61% and Century Zinc concentrate at 36%, the concentration is shown as a percent of the batch concentration. During commissioning of the Antamina pipeline a number of salt slugs were injected into the pipeline when pumping water. Curve A in Figure 2 is obtained from the measured increase in conductivity at the terminal following a step injection of salt at the pump station. Pumping was continuous at . Curve B shows the concentration increase (expressed as 0 to 100%) as Batch 1 of copper concentrate entered the Antamina terminal. This was also pumped continuously at . Curve C shows the concentration increase (expressed as 0 to 100%) as Batch 1 of zinc concentrate entered the Century terminal. This batch was pumped continuously at . The average density and viscosity between the water and the slurry. The predicted times to reach 99% purity are 9.3 minutes, 9.8 minutes and 12.5 minutes respectively for curves A, B and C. The agreement is excellent.
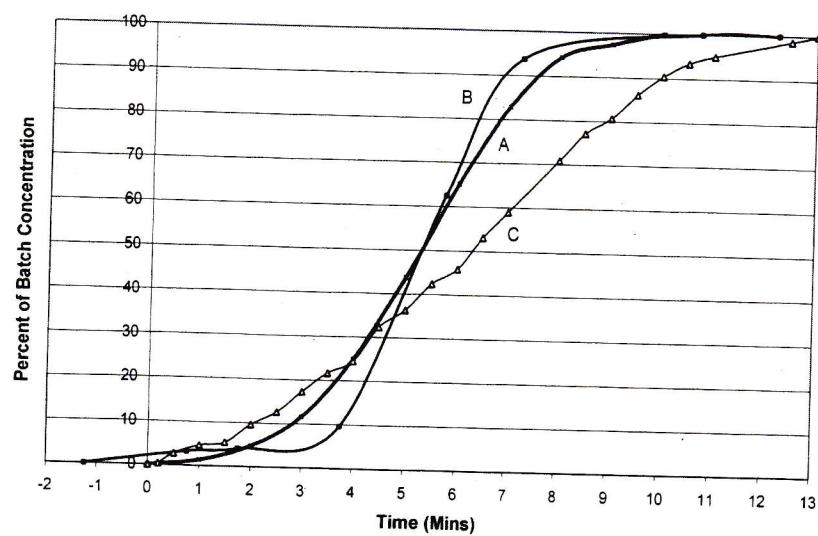
Figure 2 Increase in concentration entering terminal versus time
4.3 Trailout at end of continuously flowing batch
Figure 3 shows the decrease in concentration at the end of a batch as it enters the terminal expressed as a percentage of the original batch concentration. Data are shown for Antamina salt slug, Antamina copper concentrate and Century Zinc concentrate. Curve A is from the
same salt slug tests previously discussed in Figure 2. The step decrease in salt injection at the pump station had spread out to about 10 minutes as the end of the salt slug entered the Antamina terminal. This decrease in salt concentration mirrors the increase at the head of the salt slug previously shown in Figure 2. Curve B in Figure 3 shows the decrease in concentration as the tail of Batch 1 entered the Antamina terminal. Curve C is the equivalent curve for the trailout of the first zinc batch into the Century terminal. Lines D, E and F are predictions to be discussed below.
In 1992 the principal author carried out extensive tests on trailout in the 155 km Ok Tedi copper concentrate pipeline. Some of this work was reported by Venton and Boss (2). During the design of the Century pipeline information from these Ok Tedi tests was used to develop
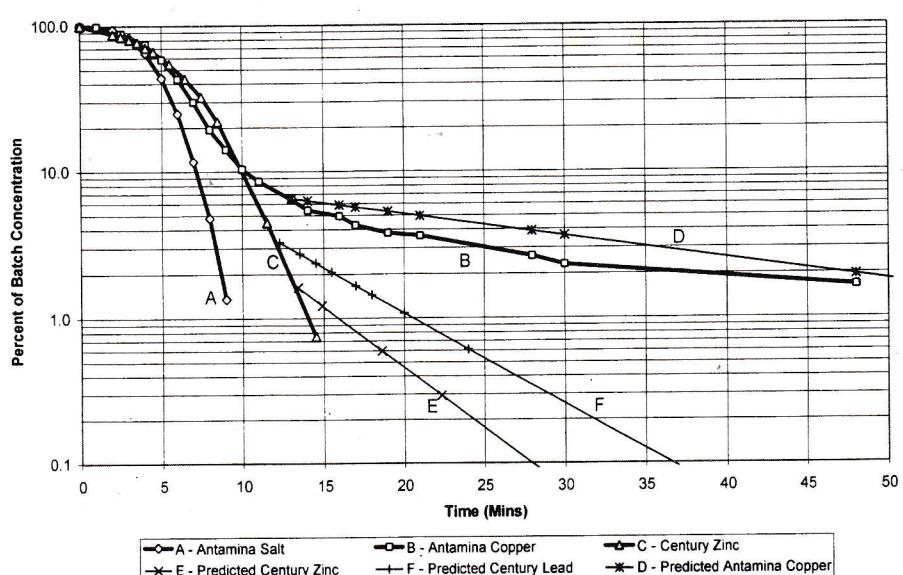
Figure 3 Trailout of solids at end of batch
a prediction method to predict trailout in the Century pipeline. Examination of trailout of a number of Ok Tedi batches indicated two distinct phases. The concentration decreases rapidly for about the first 10 to 15 minutes reducing to between 5% to 7% of the original concentration during this phase. The curve relating concentration to time during this first trailout phase follows a similar shape as the homogeneous decrease based on interfacial mixing which is illustrated by the Antamina salt curve A in Figure 3. The shape similarity is particularly evident when comparing the Century zinc curve C with the Antamina salt curve A. The initial phase of the Antamina copper concentrate curve B also has a similar shape.
Following the initial phase the trailout behaviour changes significantly and becomes strongly dependant on the particle size. During the second phase the concentration decrease is approximated by a straight line on the log-linear plot indicating an exponential decrease with time. To emphasise the significance of the coarser particles in the size consistent with the particle size was selected for the analysis. Three sets of Ok Tedi trailout data were used having
sizes ranging from 120 microns to 65 microns. The concentration decrease was slower for the coarser particles. The following equation approximated the Ok Tedi data:
where A and B were assumed functions of the ratio of the equivalent sphere particle settling velocity in water, , to the pipeline friction velocity, where and is the Fanning friction factor. A and B were themselves approximated by exponential functions. Two ratios involving pipeline length L and velocity V were also incorporated to allow for pipeline lengths and velocities differing from the 155 km and 1.2 m/s applying at Ok Tedi.
Applying the phase 2 predictions (Eqn 1) to Antamina copper concentrate results in line D. This line over-predicts the measured behaviour (curve B) slightly but approximates the general slope of the data. Lines E and F are similar phase 2 predictions for Century zinc and lead concentrates. Figure 3 indicates the Century zinc and lead concentrates are predicted to trailout to less than 1% of the original concentration after 16 and 21 minutes respectively.
Predicted concentration decrease using Eqn 1 is known to apply to Ok Tedi data. Figure 3 shows it approximates the Antamina Batch 1 data also. Although no sampling was done after 15 minutes trailout of the first Century zinc batch the predicted phase 2 behaviour (line E, Fig. 3) does not seriously conflict with the measured concentration decrease, curve C.
The concentration decrease for the first Century zinc batch was obtained by sampling out of 25 mm and 50 mm tee pieces. The samples are likely to represent well mixed samples from within the pipe. After this first batch a nuclear density gauge was installed at the terminal and subsequent concentration data are as measured by this instrument. The concentrations measured by this instrument shows a higher concentration and more extended trailout than the predicted lines E and F. The measurements are in fact similar to the Antamina curve B.
One possible explanation for the discrepancy between the predicted and measured trailout at Century relates to the mounting of the density gauges. At both Antamina and Ok Tedi the terminal density gauges are mounted in a vertical pipe section. They therefore measure the delivered concentration. At Century the density gauge is mounted in a horizontal pipe section in a horizontal configuration. It is possible that the Century density gauge readings are higher than predicted because the gauge is detecting high concentrations in the bottom half of the pipe.
During the Ok Tedi tests a clear viewing section was used to observe trailout behaviour. Sampling tubes were also inserted in the pipeline entering the terminal to permit samples from the top, middle and bottom of the pipe. During trailout large differences in sampled concentrations were measured between top, middle and bottom. For example with one batch, 25 minutes after trailing began the top, middle and bottom concentrations were respectively 1.8%, 2.4% and 12.7%. At the same time the nuclear density gauge mounted in the vertical pipe indicated 1.8% concentration. Forty minutes after trailing began the sampled concentrations were respectively 1.1%, 1.6% and 14.8% whilst the density gauge indicated
0.9%. i.e. in both cases the concentration from the middle sample tube was higher than measured by the density gauge. Visually there was a slower velocity than the general pipeline wide moving in the bottom dot at a nuclear density gauge mounted in a horizontal pipe velocity. The Ok Tedi data suggest that a nuclear density gauge mounted in a horizontal pipe may indicate a higher concentration than the actual delivered concentration. The higher than predicted concentrations measured by the Century density gauge may therefore be due to the mounting arrangement. Alternatively the discrepancy may indicate that the theory based on extrapolation of Ok Tedi data to the smaller Century particle sizes is not valid. However this then does not explain why batch 1 trailout at Century (Fig. 3), measured by sampling, seems to agree with the theory.
4.4 Estimating Batch Contamination
Trailing solids in the water batch are picked up by the following slurry batch. If the following batch is different concentrate the solids picked up represent contamination. Integration of equation 1 allows an estimate of the amount of solids picked up in the following batch. Consider a single slurry batch with the remainder of the pipeline filled with water. When the slurry batch enters the terminal solids concentration trailout will occur as indicated in Figure 3. As an extreme case it can be assumed solids trailout all the way back to the pump station although the concentration there is of course infinitely small. These very long trailouts do occur. Following arrival of the second copper concentrate batch at the Antamina terminal trace amounts of solids were observed in water samples entering the terminal 20 hours later. Similar effects were noted at Ok Tedi with trace solids visible in the viewing section 19 hours after the end of a batch.
Consider now the case where a slurry batch is following the first batch, say with a 60 minute water batch separating the two. All the solids which previously were trailing all the way back to the pump station, are now picked up by the following slurry batch. Integration of Eqn 1 from to is the transition from to . Integration of Eqn 1 from to gives
The volume of the Antamina pipeline is and at a typical the transit time (45.5 hours). Equivalent parameters for the Century pipeline are volume and (70 hours). The first term in the integrand is therefore extremely small and can be neglected. The resulting average concentration in the water-filled pipeline stretching back from is given by:
remembering that is based on 100% representing the batch concentration. Knowing and the total volume of the pipeline from back, the mass of solids which are picked up by the batch following after time can be estimated. Table 2 summarises predicted contamination in the Antamina and Century pipelines based on Eqn 4 and the predicted concentration decay as illustrated in Figure 3. The predictions used in Table 2 suggest there will be negligible contamination across the 2 hour water batches used in both Century and Antamina to separate sensitive batches. However these predictions must be treated with some caution for the reason discussed below.
Table 2
Predicted contamination mass in following batch (tonnes)
| Water Batch Length (Minutes) (= ) | 15 | 30 | 60 | 120 |
|---|---|---|---|---|
| Century Zinc Concentrate A = 21 B = 0.187 | 0.11 | 0.007 | ||
| Century Lead Concentrate A = 19 B = 0.145 | 0.27 | 0.03 | ||
| Antamina Copper Concentrate A = 10.3 B = 0.0348 | 2.9 | 1.03 | 0.13 |
The analysis is based on the delivered concentration. The very fact that trailout occurs means that the trailed solids are travelling at a lower velocity than the bulk flow. Hence the in-situ concentration in the horizontal pipe will be higher than the delivered concentration. This is indicated by the high concentrations measured at the bottom of the pipe at Ok Tedi and probably explains the higher than expected concentrations measured by the density gauge at Century during trailout. Limited analysis of the hump at the beginning of the following batch at Antamina (see later Fig. 6B) does suggest possibly somewhat higher contamination rates than predicted in Table 2. Century are installing an on-line analyser at the terminal to assay the head of the batch. This may provide additional information. Of course even if actual contamination is higher than predicted in Table 2, contamination as a percentage of the whole batch will still be very low with the current two hour water batches used in the two pipelines.
4.5 Effect of shutdown on arrival and trailout
Figures 2 and 3 apply to cases where the batch is transported continuously without shutdown. If the batch is shutdown during the transport the arrival and trailout times are generally increased. During restart the pump speed is slowly ramped up over a 5 to 10 minute period. In the initial phase of this ramp up the velocity in the pipeline may be insufficient to fully suspend all settled solids thereby "stretching" the arrival and trailout time. This effect is exacerbated by delays in the pipeline. At Century a 10 minute ramp up of flow at the pump station typically translates to about an hour required for the flow rate at the terminal to increase towards the period at low velocities with possible insufficient suspension about 15 minutes to approach equilibrium. At Antamina the terminal flow rate typically takes about 15 minutes to increase arrival and trailout times by about a factor of three at Century and by about a factor of two at Antamina.
Concentration variations caused by density currents (see Shook et al 3,4) during shutdown can sometimes have the effect of reducing the arrival or trailing time. Suppose for example that the density currents in a steep downward sloping section of the pipeline when shutdown decrease the length of the tail. This effect was particularly noticeable in the Antamina pipeline. Figure 4 shows the measured concentration during trailout for eleven copper concentrate batches. All batches, including water batches are numbered so slurry batches are odd numbered. Only one of these batches was pumped continuously, all other batches being shutdown for various periods, either intentionally or unintentionally. The full line indicates the continuous flow batch trailout. The data for the shutdown batches straddle the continuous flow results suggesting that density currents during shutdown can sometimes decrease trailout time depending on the location of the tail during the shutdown.
The possible increase in arrival and trailout times after pipeline shutdown will influence decisions on water batch separation lengths. What may be sufficient batch separation for continuous flow may need to be increased to allow for unscheduled shutdowns. This consideration has no doubt influenced the decision to use 2 hour water batch separation in both pipelines.
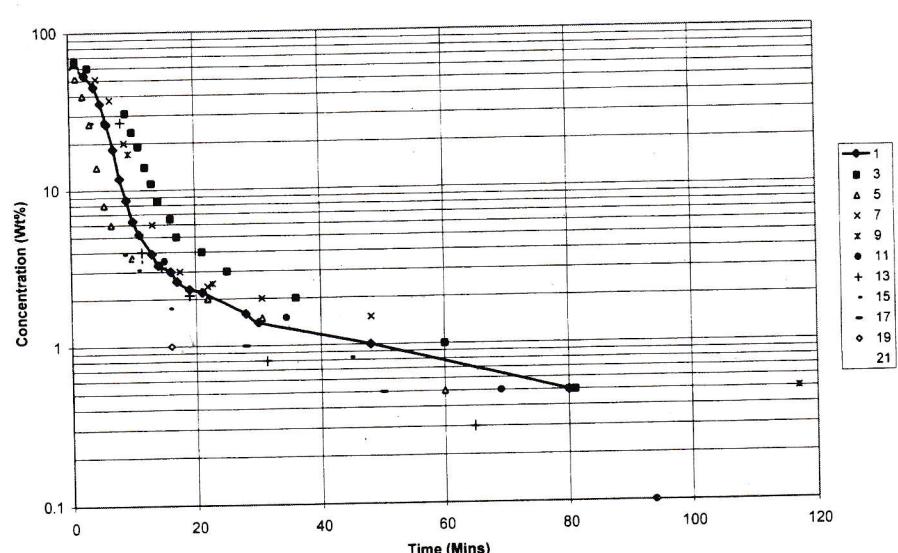
Figure 4 Trailout of first 11 batches at Antamina
5. CONCENTRATION VARIATIONS WITHIN A BATCH
5.1 Concentration variations within a batch following shutdown
In a similar manner as discussed above in relation to the head and tail of a batch, density currents during shutdown also result in concentration variations within the body of a batch as it enters the terminal after restart. Figure 5 shows the concentration trace within a batch of Antamina Batch 3 copper concentrate as it entered the terminal after a 3 hours 45 minute shutdown (Curve A). During shutdown the head of the batch was at Km 64 and the x axis shows the location of the batch during shutdown in kilometres. This allows comparison between the concentration variations and the route profile in the shutdown region, curve B. (Route elevation shown on right axis).
It can be seen that the very low 37% concentration trough coincides with the high point of the pipeline at Km 55.4. During shutdown, density currents have transferred solids more than 500 m in each direction from the high point. The pipeline slope 500 m back from the peak is a constant 3.9%. The slope 500 m forward from the peak is representing 42% of the average concentration. The other significant low concentration trough (53%) coincides with the valley and subsequent small peak around Km 61.3. The route profile was available with maximum 10 m intervals and close analysis between Km 56 and Km 60 indicates slope variations ranging from a maximum 7% to a minimum of 2% always in the downhill direction. Figure 5
shows that these slope variations between Km 56 and Km 60 cause a peak to peak variation in concentration of about 4 percentage points representing 6.7% of the average concentration.
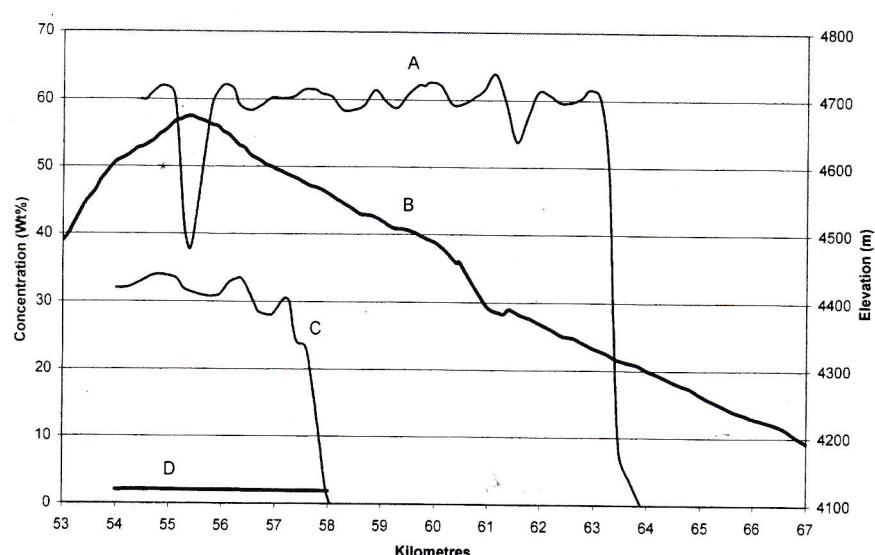
Figure 5 Concentration variations following shutdown
Similar concentration variations occur in the Century pipeline after shutdown. Curve C shows the terminal concentration trace of a section of Century zinc concentrate Batch 2 after a 10 hour shutdown. The head of this batch was located at Km 143 during shutdown so the kilometres on the x axis do not apply. However to allow comparison between the route elevation ranges from 20.4 m to 19.1 m above sea level from Km 139 to Km 143 but is shown as 4120.4 m to 4119 m to allow comparison with the Antamina profile on the same scale.
Close analysis of the Century profile between Km 139 and Km 143 revealed an average downhill slope of 0.04% but with some slight undulations with maximum downhill slopes of 0.15% and maximum uphill slopes of 0.072%. These very small variations in slope are sufficient to cause typical peak to peak variations in the concentration trace entering the terminal of about 3.6 percentage points representing about 10% of the average concentration. It should be noted that other concentration traces following shutdown at Century have resulted in concentration variations from a minimum 27% to maximum 39%, i.e. peak to peak variation of 12 percentage points representing 33% of the average concentration. These most likely relate to shutdown at river crossings where pipeline slopes are much higher. Table 3 compares relevant shutdown differences discussed above between Century and Antamina.
Table 3 indicates that peak to peak concentration variations in the Century pipeline are typically higher than in the Antamina pipeline (10% of 6.7%) even though pipeline slope variations in the Century pipeline are two orders of magnitude less. Settling rates for the
relevant shutdown periods are similar and rheology is not too disimilar. The most likely explanation is the almost order of magnitude difference in particle size and perhaps the longer shutdown period.
Table 3
Shutdown variables compared
| Antamina | Century | |
|---|---|---|
| Typical Pipeline Slope Variation in Region Considered (%) | -2 to -7 | +0.072 to -0.04 |
| Batch Concentration (wt%) | 60 | 36 |
| Shutdown Time (hours) | 3.75 | 10 |
| Peak to Peak Concentration Variation as Percentage of Average Concentration | 6.7 | 10 |
| Median Particle Size (microns) | 32 | 4 |
| Settling Rate - Settled height in measuring cylinder after the shutdown period (% of initial height) | 76.3 | 78.5 |
| Yield Stress (Pa) | 0.66 | 1.2 |
| Plastic Viscosity (mPas) | 10 | 4.2 |
5.2 Concentration variations in continuously flowing batches
Continuously flowing batches at Century and Antamina exhibit some interesting differences in concentration variation behaviour. Figure 6 illustrates typical shapes of concentration profiles entering the terminal. The Y axis is concentration as measured entering the terminal and the X axis represents time.
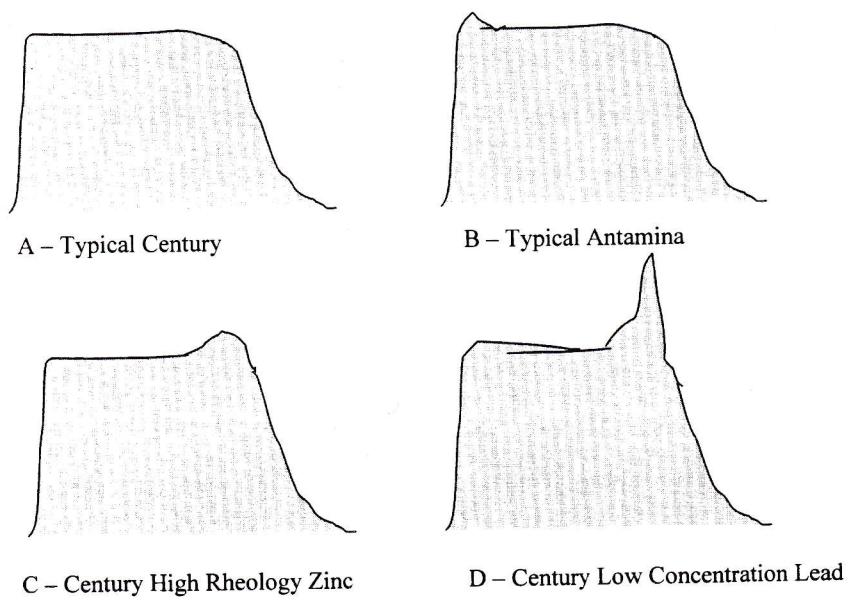
Figure 6 Shape of typical continuous flow concentration traces entering terminal
Shape A is typically observed at Century with both zinc and lead concentrates at optimum concentration. There is a steep initial increase in concentration as the batch enters the terminal followed by a relatively steady concentration period for most of the batch length. At the end of the batch the concentration decreases slower than it had increased at the head of the batch eventually ending with the extended trailout discussed in Section 4.2.
Shape B is observed with all batches at Antamina and was also observed at Ok Tedi. The hump at the start of the batch is associated with pick up of trailing solids from the previous batch. The only time the hump has not been observed at Antamina is in the very first slurry batch when there were no solids ahead of the batch to be picked up. (see Curve B in Figure 2.) The hump typically lasts about 5 minutes but can last considerably longer if the batch ahead has a coarse sizing.
Shape C is observed at Century with high rheology zinc concentrate. The hump at the rear of the batch is due to drop out of coarse solids caused by laminar or transition flow providing inadequate support for the coarser particles. These particles travel slower in the bottom half of the pipe and accumulate at the end of the batch. It is observed when the Yield Stress, as measured by the On Line Viscometer, exceeds about 1.2 to 1.5 Pa.
Shape D is observed at Century with lead concentrate when the batch slurry SG is less than about 1.7. There is a pronounced steep hump at the rear followed by an extended trailout. When the slurry SG is too low there is inadequate support to the coarser particles and they drop out and accumulate at the end of the batch. In this case there is no question of laminar or transition flow in the initial batch there is just inadequate turbulent support. However as the concentration increases towards the end of the batch laminar flow could start to occur thereby compounding the problem. In one extreme example a very low lead concentrate SG of 1.45 was pumped the hump at the rear peaked at SG 2.03, indicating that the concentration more than doubled to a peak around 63%.
The fact that no pronounced hump is observed at the start of Century batches when the slurries are at optimum concentration (Fig. 6A) suggests that trailout is less at Century than at Antamina. This could be expected because of the much finer particle size and is predicted by the analysis in Sections 4.3 and 4.4 although it is not supported by density gauge trailout measurements possibly due to the reasons discussed in those sections.
Inadequate suspension within a batch evident in Figures 6C and 6D illustrates the need to maintain optimum slurry rheology and density.
6. PIPELINE RESTART
Restart procedures for both pipelines are similar. The pumps are generally started and set at about 10% normal flow rate for a few minutes. In both cases this initial flow rate period is sometimes extended to pack the pipeline first if the previous shutdown has left some sections of the pipeline under vacuum. After this initial period the terminal valve is then opened. (In the case of Antamina the valves at each of the valve stations are then also opened starting with the terminal and working up the mountain). Once the flow path is open the pump speeds are then progressively ramped up to full speed. This ramp up period is typically of the order of 2 or 3 minutes at Antamina and about 7 minutes at Century. The rise in the discharge
pressure is closely monitored and if the pressure trend indicates maximum discharge pressure may be exceed then the pump speed is reduced for a period before being increased again.
Once a steady pump speed has been set each pipeline takes considerable time to fully reach equilibrium conditions. As noted in Section 4.5, the flow rate at the terminal typically takes about 15 minutes at Antamina and about full equilibrium is much longer. Five to six hours is required for all pressures to reach full equilibrium conditions when pumping water although flow rates and pressures are reasonably steady throughout the pipeline after about one hour. When pumping slurry batches the Antamina pipeline never reaches full equilibrium since conditions are continually changing as batches move down the mountain and choke settings are adjusted. The Century pipeline takes longer to reach full equilibrium, with discharge pressure typically taking perhaps 4 hours to peak then decreasing slowly before steadying out after about 8 hours.
7. OTHER SYSTEM COMPARISONS
7.1 Agitated Tank Storage
Antamina has five 18 m high x 18 m diameter agitated storage tanks at the pump station, three for copper concentrate and two for zinc concentrate. Each tank has a live capacity of 3400 m 3 representing approximately 12 hours pumping. Each tank is fitted with a Hayward Gordon agitator powered by a 112 kW motor. During commissioning samples were collected from the top and bottom of one copper concentrate tank and revealed near perfect mixing (1.3% plus 150 microns at the top). There are three 15 m high x 15 m diameter tanks at the Antamina terminal, each with 93 kW agitators.
Century has four 12.5 m high x 12 m diameter tanks at the pump station, three for zinc concentrate and one for lead concentrate. Each tank has a live capacity of approximately 1150 m 3 representing about 4 hours pumping capacity. The zinc tanks are fitted with Lightner agitators powered by 55 kW motors. The lead concentrate terminal, two zinc concentrate and one lead concentrate, fitted with similar 55 kW and 75 kW agitators respectively.
7.2 Test Loop
Both Century and Antamina have test loops installed. These were used during commissioning to assess slurry pumping suitability. They are not generally used in day to day operation unless a particularly unusual slurry is encountered. The Century testloop consists of a magnetic flow meter, a nuclear density gauge mounted at 45 0 across the horizontal pipe and a differential pressure transmitter. Sampling tubes are mounted at top, middle and bottom of the pipe.
Space considerations required the Antamina test loop to consist mainly of 20 m diameter bends around the storage tanks with very little straight pipe. However comparing test loop measurements with expected behaviour suggests these bends have no marked influence on the slurry flow behaviour. Differential pressure is measured across a 137 m length. The loop is fitted with a magnetic flow meter and two nuclear density gauges, one mounted vertically and one horizontally on the horizontal pipe. Top, middle and bottom sampling probes are fitted.
Tests during commissioning in both test loops indicated that deposition was largely controlled by laminar/turbulent transition. Following commissioning loop testing the minimum pipeline operating flow rate in the Antamina pipeline was set at representing a velocity of 1.38 m/s in the largest ID pipe section. Commissioning tests at Century indicated a minimum operating flow rate of extending down to when intermediate pressure monitoring became available. These flow rates represent velocities of 1.08 m/s and 0.89 m/s respectively.
7.3 Slurry Control Philosophy
Both Antamina and Century closely monitor slurry batch properties prior to committing them to the pipeline. In each case sampling points are installed approximately 2 m from the bottom of each tank. Samples are collected and particle size, solids concentration and rheology measured in the laboratory. The Yield Stress is of major interest. If it is too high and likely to result in laminar flow in the pipeline, the slurry is diluted. At Antamina dilution to a target density determined by the laboratory tests is generally achieved by adding water to the suction manifold. At Century an On Line Viscometer is installed which continuously measures the Yield Stress of the slurry entering the suction of the mainline pumps. The Yield Stress is maintained at the required set point, generally 1 Pa, by automatic water injection into the suction pipe controlled by the On Line Viscometer.
The On Line Viscometer is particularly useful at Century because variable quantities of air entrained in the zinc concentrate (up to 15% air by volume) affect laboratory rheology determination. The On Line Viscometer measures the Yield Stress at approximately 500 kPa Charge Pump pressure where most of the air is dissolved and any remaining free air is compressed and at very small volume concentration. It is therefore measuring the slurry at conditions very close to those in the high pressure pipeline where all air will be dissolved.
REFERENCES
- 1. Smith, S.S. and Schulze, R.K., Interfacial mixing characteristics of products in products pipe line, The Petroleum Engineer, Oct 1948, pp 330-337.
- 2. Venton, P.B. and Boss, T., An analysis of wear mechanisms in the 155 km Ok Tedi copper concentrate pipeline, Hydrotransport 13, 3-5 Sept 1996, Johannesburg, BHR.
- 3. Shook, C.A., Rollins, J., and Vassie, G.S., Sliding in inclined slurry pipelines at shutdown, Canadian Jnl of Chemical Engineers, Vol 52, June 1974, pp 300-305.
- 4. Shook, C.A., and McLeod, D.J., The effect of line length for inclined slurry pipelines at shutdown, Canadian Jnl of Chemical Engineers, Vol 53, Dec 1975, pp 594-598.
ACKNOWLEDGEMENTS
The authors thank Pasminco Century Zinc Limited and Compania Minera Antamina for permission to publish this information. The principal author also thanks Ed Wasp for support during Antamina commissioning. Thanks also to Mike Weston and Ramesh Gandhi of Bechtel, San Francisco, for additional information regarding lead concentrate commissioning and subsequent operation at Century.