This HTML edition contains selectable text extracted from the original PDF. Layout-aware OCR was used to recover reading order, figures and equations; minor recognition errors may remain. Consult the PDF for the authoritative layout, figures and equations.
MaxSolids™
Controlling a Tailings Pipeline to
Maximise Pumping
Concentration and Minimise
Water Consumption and Energy
Allan Thomas
Slurry Systems Engineering Pty Ltd
Typical Tailings Pumping System
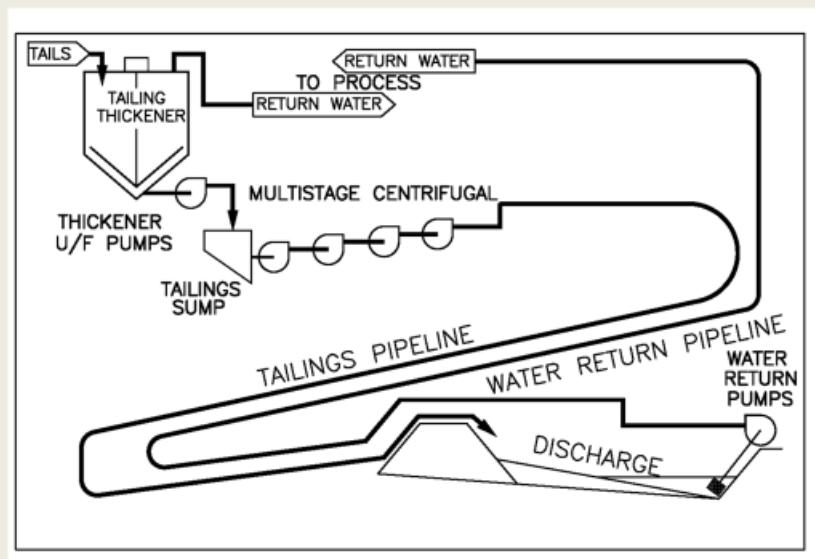
Optimum Tailings Pumping Operation
- • For constant solids throughput, if flow rate is decreased the concentration increases.
- • Optimum operating velocity is just above the deposit velocity, whether deposition is due to laminar transition or turbulent deposition.
- • By operating just above deposition MaxSolids™ gives maximum concentration, minimum water consumption and minimum pump power.
MaxSolids Control System (Patented)
- • Based on measurement of pressure drop over a short length of slightly larger diameter pipe at start of pipeline.
- • This pressure drop is combined with flow rate and density from DCS to give the MaxSolids parameter M .
- • MaxSolids control system progressively decreases flow rate within limits of M to optimise maximum concentration.
MaxSolids Parameter M
For Newtonian homogeneous turbulent flow:
Approximating with Blasius friction factor:
For a particular pipe diameter:
Viscosity is related to density so absorb into
for a non-Newtonian fluid
Two Types of Deposition
Turbulent or Laminar
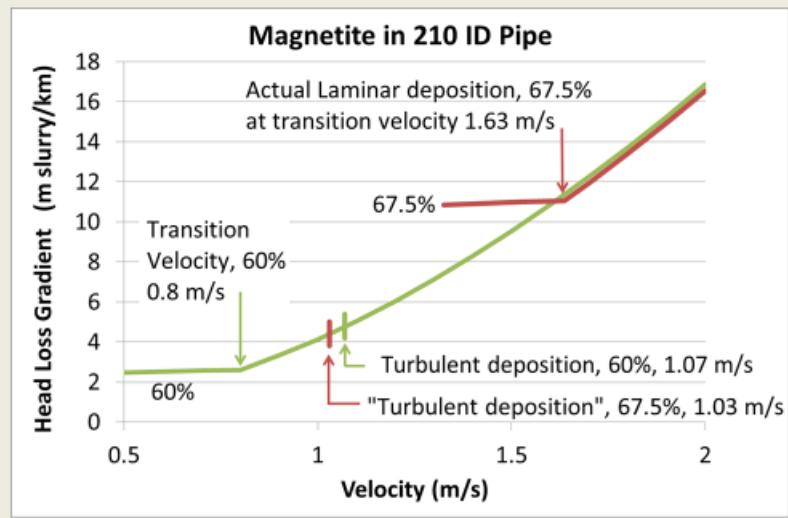
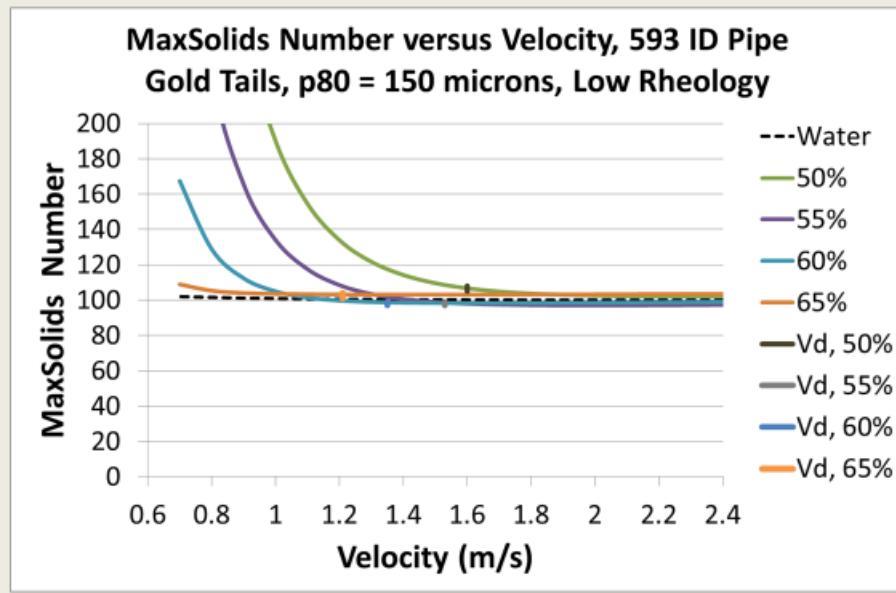
When Deposition is Controlled by Laminar Transition
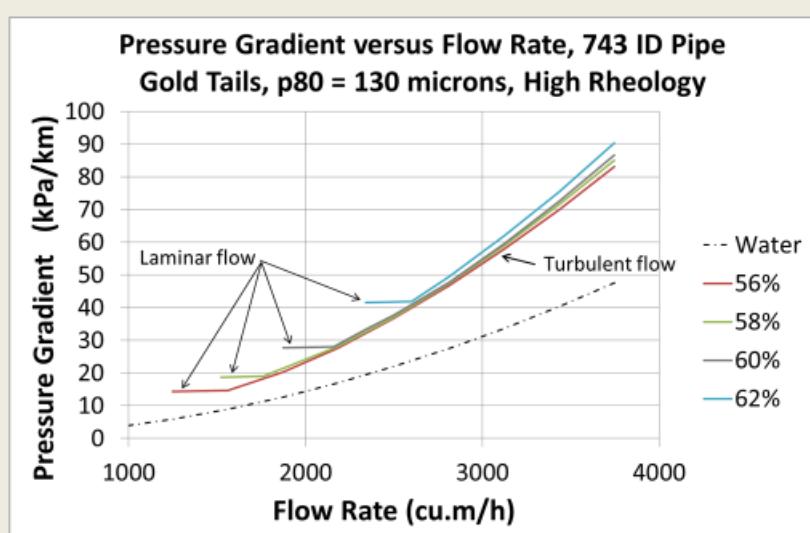
When Deposition is Controlled by Laminar Transition
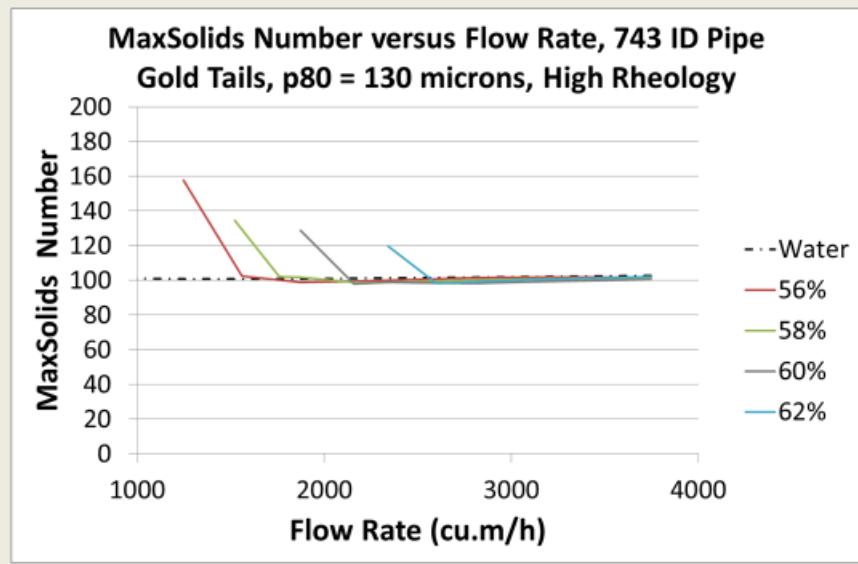
Deposition under Turbulent Flow
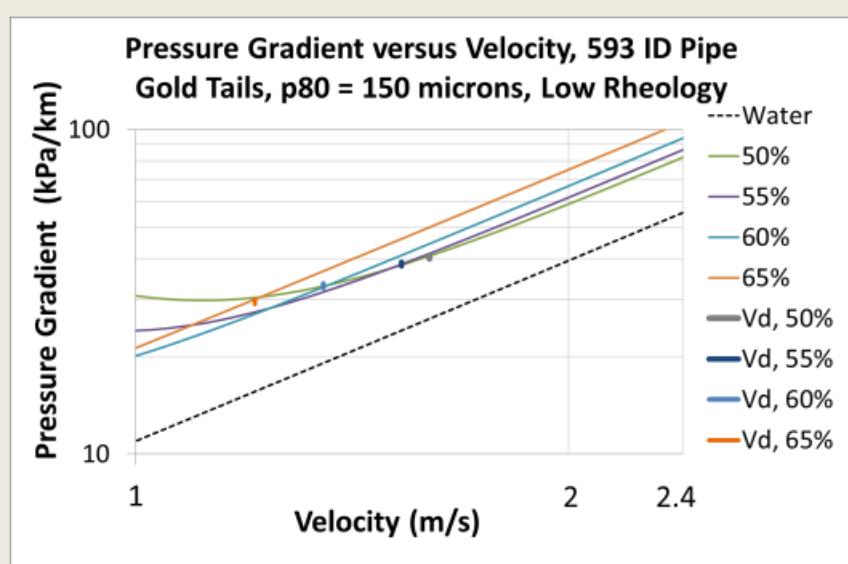
Deposition under Turbulent Flow
Case Study
- • 1000 tph dry tails
- • 500 mm ID pipe
- • 10 kms pipeline length. Flat route profile
- • Solids SG 2.8
- • Particle size, microns
- • Thickener underflow concentration 52% to 60%
- • Rheology
Yield stress 4.5 Pa at 60%, 1.35 Pa at 52%
Plastic viscosity 11.8 mPas at 60%, 6.4 mPas at 52%
Energy and Water Savings are Achieved by
Operating at Maximum Concentration (60%)
Just Above Transition
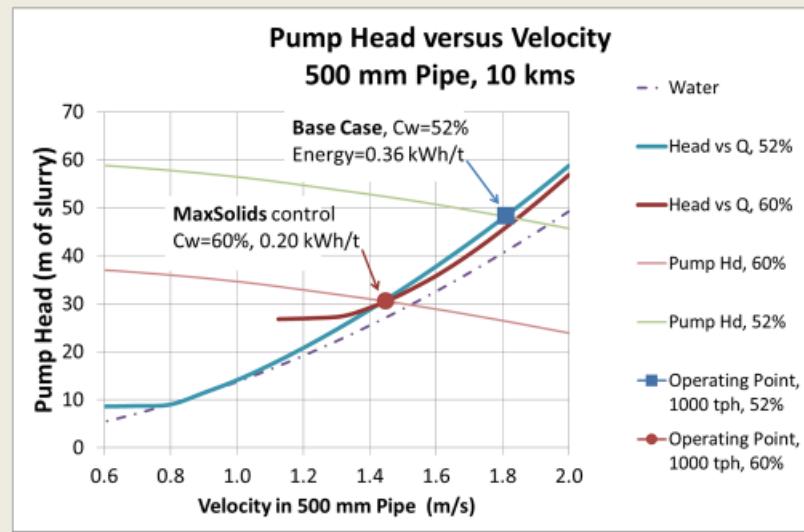
Case Study
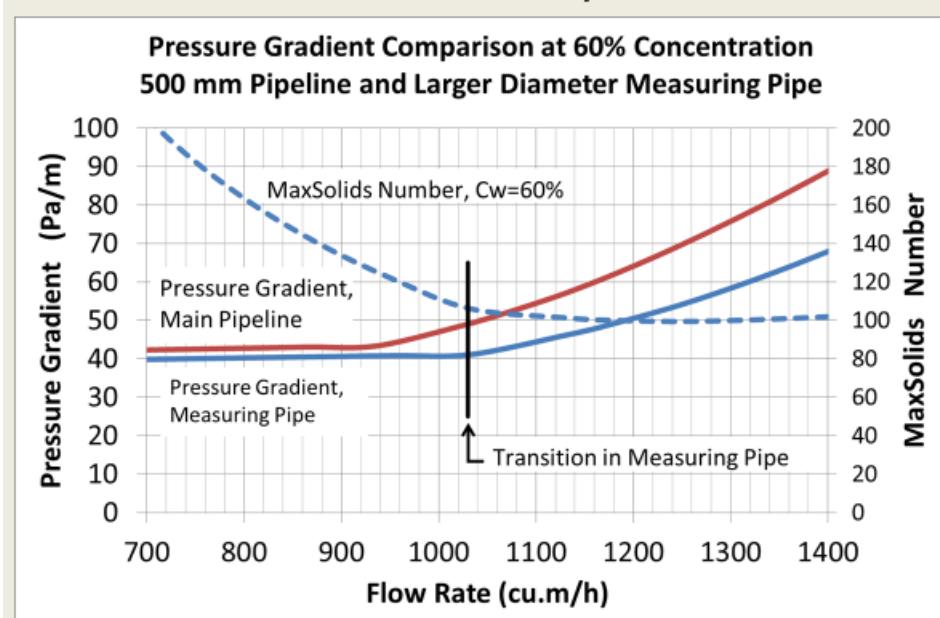
Case Study, 1000 tph Solids Throughput Benefits of Operating at 60% c.f. 52%
| At 52% Concentration | At 60% Concentration MaxSolids Control | |
|---|---|---|
| Flow rate (cu.m/h) | 1,280 | 1,024 |
| Velocity in 500 ID pipe (m/s) | 1.81 | 1.45 |
| Pump head (m of slurry) | 48.3 | 30.5 |
| Slurry Power at 0.7 efficiency (kW) | 361 | 198 |
| Water Return Power at 0.8 efficiency (kW) | 85 | 22 |
| Annual energy (MWh) (0.9) | 3,516 | 1,734 |
| Annual energy cost saving at 10c/kWh |
$178,000
(50% saving) |
|
| Water in slurry (cu.m/h) | 923 | 667 |
There will also be Annual water savings because water not pumped to TSF is not subject to evaporation.
Advantages of MaxSolids Control
- Laminar Deposition
- • Once the flow is laminar the coarser particles will start to slowly settle.
- • But with a fine particle tailings slurry, a bed of solids may not form for tens or even hundreds of metres from the pump(s).
- • MaxSolids detects the onset of laminar flow rather than the presence of a bed.
- • MaxSolids detects the onset of laminar flow in the measuring pipe while turbulent flow still exists in the main pipeline so there is no chance of bed formation in the main pipeline.
Advantages of MaxSolids Control
- Turbulent Deposition
- • When deposition occurs under turbulent flow, a bed of solids forms immediately, within a few metres of the start of the measuring pipe.
- • The MaxSolids system reacts to the higher pressure gradient and starts a step increase in the flow rate.
- • Because the velocity in the main pipeline is slightly higher than in the measuring pipe, deposition has not occurred in the main pipeline.
Feed to pipeline is either direct from thickener or via a break tank
-
• When the pipeline is direct coupled to thickener, MaxSolids controls flow rate to a minimum, resulting in higher thickener underflow concentration.
(The thickener will need to be capable of safely operating under this condition or the thickener control will need to overide the MaxSolids control) - • When the pipeline is fed from a break tank, the thickener needs to be able to deliver at higher concentration than the pipeline can handle with MaxSolids then controlling dilution water addition
Applicability
- • Applicable to almost all thickener underflows.
- • MaxSolids not applicable to very heterogeneous slurries such as gravel or coarse coal rejects where the pressure gradient exhibits a gradual, rather than a sudden deviation from the homogeneous pressure gradient curve. But these slurries are not thickened anyway.
MaxSolids™
Maximises pumping concentration within the restraints of the thickener and pumping system, so as to minimise the amount of water sent to the TSF and minimise energy consumption.
- • UTILIZES CONVENTIONAL, COMMERCIALLY PROVEN COMPONENTS
- • SOFTWARE BASED – PROGRAMMED INTO PLANT DCS
- • READY FOR FULL SCALE DEMONSTRATION
- • NO RISK TO OPERATIONS