This HTML edition contains selectable text extracted from the original PDF. Layout-aware OCR was used to recover reading order, figures and equations; minor recognition errors may remain. Consult the PDF for the authoritative layout, figures and equations.
PREDICTING THE DEPOSIT VELOCITY FOR
HORIZONTAL TURBULENT PIPE FLOW
OF SLURRIES
A. D. THOMAS
M.D. Research Company Pty. Ltd., P.O. Box 22, North Ryde, N.S.W. 2113, Australia
(Received 30 July 1978; in revised form 20 January 1979)
Abstract —The sliding bed theory of deposition recently developed by Wilson and others has been compared with a range of experimental results most of them not previously published. This comparison has confirmed the suitability of this theory for the claimed range of particle sizes for solids suspended in water. However, the results for higher viscosity fluids do not show such good agreement. This disparity is later explained following the development of a theory of deposition, based on the sliding bed concept, for very fine particles smaller than the thickness of the viscous sub-layer. Furthermore, by adding the contributions of both Wilson's theory and the viscous sub-layer theory the two types of deposition which describes deposition for particles in the transition region between the two types of deposition. The two theories combined now cover the complete particle size range for unflocculated particles. In the case of flocculated particles the new viscous sub-layer theory is shown to be consistent with experimental data providing the particle properties are used instead of the floc properties.
1. INTRODUCTION
Probably the most important requirement in the design of any hydraulic transport system is a knowledge of the critical deposit velocity—the velocity below which a stationary bed of solids will appear in the bottom of the pipe. A few years ago Carleton & Cheng (1974) reviewed over 50 correlations which had been proposed over the previous 25 yr. They concluded—“It therefore appears that hydraulic pipelines cannot be designed with confidence from design velocity correlations. Table 4 (of their paper) shows that the correlations are particularly poor at predicting velocities for large diameter pipes. It is clear that a new approach is required”.
Recently, just such a new approach has been developed progressively by Wilson (1970, 1972, 1974, 1976) and in co-operation with others, Wilson et al. (1972), Wilson & Watt (1974), and Wilson & Judge (1976, 1978) and Judge (1977). This analysis sheds valuable new light on the deposition phenomenon and explains many of the anomalies observed by previous workers. However, it is restricted to medium to coarse particles, e.g. for silica sand in water it is relevant to particle sizes above about 0.10 mm.
The purposes of this present paper are twofold:
- (a) To discuss the significance of this new theory and to provide some hitherto unpublished experimental data substantiating that theory;
- (b) To extend that theory to very fine particles.
2. THE WILSON APPROACH—THE BASIC EQUATION
Wilson's, and more recently Wilson & Judge's, analysis is based on the concept of a sliding bed of particles. They argue that once turbulent support of the particles ceases they are transported either by saltation or as a sliding bed. It is then argued that deposition occurs when the forces driving the sliding bed (pressure forces across the ends and stream at the fluid/bed interface) are no longer sufficient to overcome the solid-solid friction between the bed and the pipe wall. According to Wilson (1974) the pressure gradient, , required to move the sliding bed will be given by,
where is the gravitational constant, is the fluid density, is the ratio of solids density to
fluid density, is the volume concentration of solids in the bed, is the coefficient of sliding friction between the bed and the pipe wall, and depends on the solids concentration and can be expressed as a function of the ratio of bed height, , to pipe diameter . Since will be largely independent of pipe size [1] indicates that, for a particular concentration, deposition will occur at a constant pressure gradient regardless of pipe size. For coarse particles at the incipient deposition condition there will be essentially clear fluid flowing above the near-stationary bed so that the required pressure gradient, , can be equated to the pressure gradient for clear fluid in the reduced pipe area above the bed. But this pressure gradient can be related to the pressure gradient, , of an equal discharge of clear fluid flowing in the full pipe area. In fact, the ratio will depend on the ratio which in turn depends on the concentration. Therefore, for a particular concentration, [1] can be re-written as,
where is a constant.
But can be expressed in terms of the flow velocity averaged over the whole pipe area using the Fanning friction factor equation, and so, at incipient deposition,
where is the friction factor for clear fluid and is the critical deposit velocity.
Therefore,
In most cases and can be regarded as being constants and is roughly constant for large pipe sizes so that [4] reduces to
where is a constant for a particular concentration. This will be recognised as the well known classic equation presented by Durand (1953). For a prediction method to be successful this broad agreement is necessary since it is well recognized that deposition for medium to coarse particles sizes is described approximately by Durand's equation. But, as has been pointed out by Wilson (1976) and Wilson & Judge (1978), as the particle size is made increasingly finer or coarser, the sliding bed theory is able to describe the situation far better than the empirical Durand equation.
Note that the Froude number form of Durand's equation [5] can be seen to arise from the constancy of (and hence ) at deposition rather than any ratio of inertial to gravity effects. It would seem, therefore, that Durand's success with the Froude number form of [5] was to some extent fortuitous.
An important point arising from the sliding bed theory is that the basic equation controlling deposition, [1], is independent of particle size. This is consistent with the concept of a sliding bed since the solid/solid friction between the bed and the pipe wall would be expected to be the same regardless of the size of the particles within the bed. This now explains why Durand found that the parameter in [5] was constant for particles greater than 2 mm.
3. THE EFFECT OF EXTREME VALUES OF PARTICLE SIZE
It has been noted above that the basic sliding bed equation, [1] is independent of particle size. However, in the model there are two major effects which modify [1], and these effects become increasingly important at extreme values of particle size.
For a specific pipe size as the particle size is increased above about 0.5 mm (for sand) the sliding bed model predicts a decrease in the deposit velocity. This is due to the combined effects of increased relative roughness of the bed surface and an increase in the settled volume of the bed as the ratio of particle size to pipe diameter increases. The overall effect can be conveniently studied on a plot of vs . Figure 1 is such a plot for sand of relative density 2.65. The theoretical curves have been obtained from the papers of Wilson & Judge (1977, 1978). The line marked as the upper limit is the "maximum maximorum" given by Wilson & Judge (1977). The dashed portions of the lines represent extrapolations to pipe sizes not considered in the above references. These extrapolations may not be strictly valid but they at least serve to indicate probable trends.
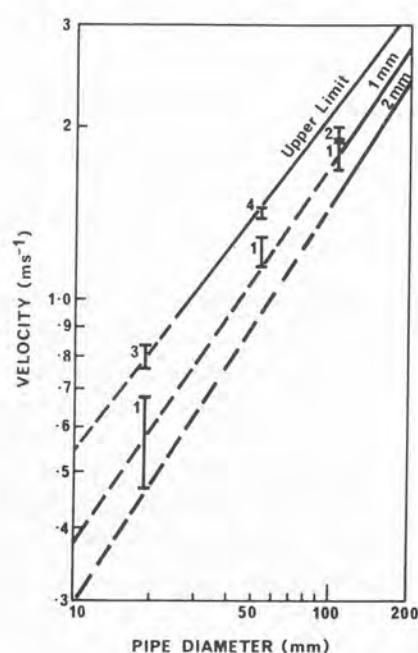
Figure 1. The effect of increasing particle size on deposit velocity. Comparison between the predictions of Wilson & Judge (1977, 1978)—full lines, and experimental results for 1–1.2 mm, 2–0.21 mm, 3–0.13 mm and 4–0.18 mm silica sand in water at a concentration of 12%.
All of the experimental data are for narrow size range sands at a concentration of 12% by volume (see table 1). Details regarding experiments are given in the appendix. In the range no great variation of deposit velocity with concentration is observed although the theory does account for a concentration effect. For the present this will be ignored so that the predicted curves in figure 1 will be assumed to apply to 12% concentration. Upper and lower limits are shown for the experimental data. At the upper limit no stationary bed was observed. At the lower limit a stationary bed was observed. The true critical conditions, therefore, lie somewhere between these two limits. The experimental data show broad agreement with the theory. Of particular importance, is the success of the theory in predicting the lower deposit velocity of the 1.2 mm sand compared to the finer sands.
Thus, this experimental data, although limited, does substantiate the sliding bed theory as regards coarse particle effects.
3.2 The effect of a decrease in particle size
As the particle size is made smaller turbulence can support an increasing proportion of the particles, with a corresponding reduction in the proportion in the sliding bed, i.e. a lower value
Table 1. Observed deposit velocities for sand in water at 12% volume concentration†
| No. | Particle Size (mm) | ↑ | Pipe Size | Temperature °C | Observed Deposit Velocity V d (ms -1 ) | ||
|---|---|---|---|---|---|---|---|
| d 50 | d 95 | d 05 | D (mm) | ||||
| Upper Limit Lower Limit | |||||||
| 1 | 1.20 | 0.80 | 1.85 | 18.9 | 25 | 0.68 | 0.47 |
| 53.8 | 27 | 1.29 | 1.14 | ||||
| 105 | 27 | 1.88 | 1.69 | ||||
| 2 | 0.21 | 0.16 | 0.32 | 105 | 30 | 2.00 | 1.88 |
| 3 § | 0.13 | 0.095 | 0.15 | 9.41 | 30 | 0.71 | 0.60 |
| 18.9 | 25 | 0.84 | 0.76 | ||||
| 53.8 | 28 | 1.27 | 1.04 | ||||
| 105 | 30 | 1.49 | 1.44 | ||||
| 4 | 0.18 | 0.125 | 0.30 | 53.8 | 30 | 1.43 | 1.39 |
| 105 | 30 | 1.88 | 1.79 | ||||
† Actual delivered concentrations at deposition ranged from 9 to 12%.
‡ d 50 is the median particle size. d 05 and d 95 are the mesh sizes upon which 5% and 95% of the particles are cumulatively retained respectively.
§ The results for this sand in the 18.9, 53.8 and 105 mm pipes have previously been published - A.D. Thomas (1977).
of h/D . This lowers the pressure gradient required to slide the bed and hence results in a lower deposit velocity. A further factor causing a lower deposit velocity is that the suspended particles raise the apparent density and viscosity of the suspended mixture meaning that a lower velocity can achieve the same pressure gradient. Both of these effects are allowed for in the sliding bed theory and the resulting predictions are seen in figure 2 obtained using the nomograph supplied by Wilson & Judge (1978). That nomograph did not extend to pipes smaller than 100 mm. For these pipe sizes the concept introduced by Wilson & Judge (1976) has been employed and the resulting predictions are shown as dashed lines. The line marked as the upper limit is the "maximum maximorum" given by Wilson & Judge (1977). This was not given for pipe sizes below 25 mm but the extrapolation to smaller pipe sizes is shown dashed. Whether in fact this extrapolation is correct is not known.
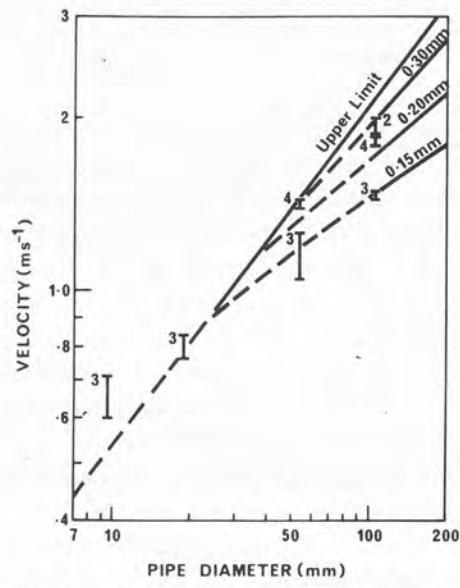
Figure 2. The effect of decreasing particle size on deposit velocity. Comparison between the predictions of Wilson & Judge (1976-1978) and experimental results for 2-0.21 mm, 3-0.13 mm and 4-0.18 mm silica sand in water at a concentration of 12%.
Experimental data (from table 1) for 0.13, 0.18 and 0.21 mm sands in water are shown plotted. Before comparing this data with the theoretical predictions it needs to be mentioned that the water temperatures in these experiments were generally around 30°C, whereas it is believed that the theoretical predictions given by Wilson & Judge (1978) nomograph are for a temperature of 20°C. The settling velocities of 0.13, 0.18 and 0.21 mm sand particles in 30°C water are about equivalent to the settling velocities of 0.15, 0.20 and 0.23 mm particles respectively in 20°C water. When this adjustment is made it can be seen that the data agrees closely with the theoretical predictions. The main discrepancy occurs in the case of the 9.41 mm pipe but further consideration of this will have to await further developments from Wilson and Judge. Particularly important is the way in which the predicted lessening of dependence on pipe size with increasingly finer particles is seen to occur in practice (see figure 1). Thus, once again, the sliding bed theory has been seen to agree with experimentally observed trends, this time as regards the effect of decreasing particle size.
3.3 The use of as a correlating tool
It has been pointed out by Wilson & Judge (1976) and Judge (1977) that the theoretical predictions of their sliding bed model for medium size particles can be expressed by the following:
valid for .
is the familiar Durand variable given by [5] and is given by
where is the settling velocity of a particle of size and is the drag coefficient of that particle.
It has already been shown how the sliding bed model successfully describes the behaviour of medium size sand in water (figure 2). Equation [6] now provides a useful means of comparing the theory for these size particles with experimental results covering a range of fluid and solid properties. Figure 3 is a plot of at deposition vs for such data. All of the materials used had particle size distributions which could be termed narrow and all are for the one nominal concentration of 12% by volume. Further details are given in table 2. The data for 0.13, 0.18 and 0.21 mm sand from table 1 are also included. The data cover the following range of variables.
where is the fluid viscosity.
In each case has been calculated as for a sphere of diameter . Once again the lower and upper limits on the experimental values of refer to conditions with and without a stationary bed respectively.
It can be seen that over the claimed range of applicability, , there is general agreement between [6] and the experimental data. Consideration of table 2 will reveal that the greatest disparity often occurs for the high viscosity fluids. If data relating to viscosities greater than (shown ringed in figure 3) are ignored then the remaining data straddle
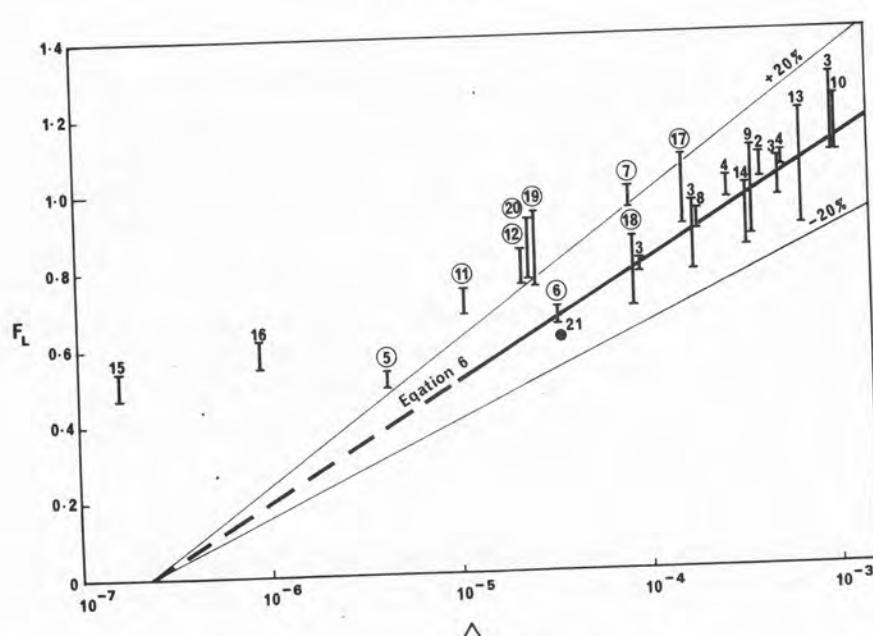
Figure 3. The use of as a correlating tool. Comparison between [6] and observed values of at deposition for a concentration of 12%. For experimental conditions refer to numbers in tables 1 and 2. Ringed numbers indicate fluid viscosities greater than .
Table 2. Relevant data at deposition for a range of solids and liquids. Solids concentration nominally 12%†
| No. | Material | Properties of Solids | Properties of Liquid | Pipe (mm) | Observed Deposit | ||||||
|---|---|---|---|---|---|---|---|---|---|---|---|
| Density | Particle Size (mm) | Density (Kg m -3 ) | Viscosity ( (Nsm -2 )) | Upper Limit | Velocity (ms -1 ) | ||||||
| (Kg m -3 ) | |||||||||||
| 5 | Silica Sand | 2650 | 0.13 | 0.095 | 0.15 | 1160 | 5.0 | 105 | 0.86 | 0.80 | .96 |
| 6 | Silica Sand | 2650 | 0.13 | 0.095 | 0.15 | 1060 | 1.67 | 105 | 1.21 | 1.15 | .93 |
| 7 | Silica Sand | 2650 | 0.90 | 0.51 | 1.50 | 1300 | 56 | 105 | 1.50 | 1.43 | 1.56 |
| 8 | Ilmenite | 4470 | 0.13 | 0.10 | 0.21 | 1000 | 0.80 | 105 | 2.51 | 2.39 | 2.45 |
| 9 | Ilmenite | 4470 | 0.13 | 0.10 | 0.21 | 1000 | 0.80 | 53.8 | 2.11 | 1.66 | 1.97 |
| 10 | Ilmenite | 4470 | 0.13 | 0.10 | 0.21 | 1000 | 0.85 | 18.9 | 1.40 | 1.23 | 1.39 |
| 11 | Ilmenite | 4470 | 0.13 | 0.10 | 0.21 | 1160 | 4.75 | 105 | 1.80 | 1.65 | 1.75 |
| 12 | Ilmenite | 4470 | 0.13 | 0.10 | 0.21 | 1140 | 3.2 | 105 | 2.06 | 1.83 | 1.75 |
| 13 | Ilmenite | 4470 | 0.17 | 0.11 | 0.24 | 1000 | 0.80 | 105 | 2.75 | 2.70 | 1.70 |
| 14 | Ilmenite | 4470 | 0.17 | 0.11 | 0.24 | 1000 | 0.80 | 53.8 | 2.27 | 1.70 | 1.70 |
| 15 ‡ | Silica Sand | 2650 | 0.017 | 0.014 | 0.021 | 1000 | 1.0 | 18.9 | 0.42 | 0.37 | 0.42 |
| 16 ‡ | Silica Sand | 2650 | 0.026 | 0.008 | 0.045 | 1000 | 1.0 | 18.9 | 0.47 | 0.42 | 0.43 |
| 17 | Silica Sand | 2650 | 0.18 | 0.11 | 0.30 | 1150 | 1.8 | 52.5 | 1.11 | 0.93 | 0.93 |
| 18 | Silica Sand | 2650 | 0.18 | 0.11 | 0.30 | 1250 | 2.91 | 52.5 | 0.93 | 0.74 | 0.74 |
| 19 | Silica Sand | 2650 | 0.18 | 0.11 | 0.30 | 1350 | 5.60 | 52.5 | 0.93 | 0.74 | 0.74 |
| 20 | Silica Sand | 2650 | 0.18 | 0.11 | 0.30 | 1096 | 5.79 | 52.5 | 1.11 | 0.93 | 1.74 |
| 21 | Iron Powder | 7475 | 0.055 | 0.045 | 0.080 | 770 | 1.1 | 25.4 | 1.27 | 1.27 | 1.74 |
† Delivered concentration at deposition ranged from 10 to 14%.
‡ Nos 15 and 16 are for concentration from zero to 20%.
References: Nos. 5 to 16 - present study
Nos. 17 to 20 - Shook et al (1973)
No. 21 - Sinclair (1959, 1962)
the predicted value in almost every case. On the other hand some of the higher viscosity data (e.g. 6 and 18) do fall on the predicted line. This suggests that there is some additional factor, related to viscosity, which is influencing deposition.
For the present, it can be said that figure 3 provides further evidence of the suitability of [6] and the sliding bed theory especially for low viscosity fluids, (e.g. water).
4. A LOWER LIMIT TO THE DEPOSIT VELOCITY—VISCOUS SUB-LAYER DEPOSITION
4.1 Behaviour with increasingly finer particles
The sliding bed model as reported to date, Wilson & Judge (1976-1978) and Judge (1977), results in an ever decreasing deposit velocity for fine particles as the particle size is reduced.
The steady decrease in with decreasing on figure 3 is evidence of this fact. The question arises as to what is the behaviour at values below the limit of applicability imposed by the above authors on their sliding bed theory? Clearly [6] is not suitable for values much less than since for it gives negative values of . Therefore, for very fine particles in water, e.g. the 17 and 26 sand (data points 15 and 16 on figure 3) some other deposition criterion is required. Similarly, it was previously noted that the data for high viscosity fluids showed the greatest disagreement with [6]. This suggests that, qualitatively, the ratio of particle size to fluid viscosity, , may be an important variable.
One physically meaningful variable which does include this ratio is the ratio where is the thickness of the viscous sub-layer given by (see Hinze 1959)
where is the friction velocity (given by ) for a fluid of viscosity and density . The role of the ratio is envisaged as follows. In the Wilson and Judge sliding bed model the height of the sliding bed continuously decreases as the particle size decreases due to more and more particles being supported by turbulence. Thus the height of the sliding bed is determined by the relative intensity of turbulence to the particle fall velocity and as a result depends on as per [6]. It is now suggested that as the particle size is reduced, or the viscosity is increased, (i.e. the ratio is reduced) eventually a stage is reached when becomes less than unity. When this occurs particles can reside wholly within the viscous sub-layer and so not be affected by the turbulent eddies. Therefore, although turbulence may be able to support certain size particles in the core region, the same size particles within the sub-layer may still deposit out if the viscous forces within the sub-layer are insufficient to keep them moving. Thus, becomes irrelevant and a different analysis is required once becomes less than . Typically, for silica sand in water, this occurs for particle sizes below about 25 . It should be noted that the necessity for a different analysis once has long been recognized, e.g. Shields (1936) for the case of incipient motion of a single particle in open channel flow, and Thomas (1962/1 and 2) in the case of deposition in pipe flow.
4.2 Application of the sliding bed concept to particles within the viscous sub-layer
Following the reasoning above it is now assumed that all particles residing wholly within the viscous sub-layer, since they are not supported by turbulence, must make up the sliding bed. Thus the height of the sliding bed will depend directly on and in fact for present purposes can be assumed equal to . This means that will be small, generally less than . Consider the basic sliding bed equation [1]. It can be shown, using the equations given by Wilson (1974), that the limiting value of as is given by
Substituting this into [1] with placed equal to results in,
Incorporating [8] for this becomes
where is the friction velocity calculated as for fluid flowing alone at a velocity .
In the case of low solids concentration which then is given by the familiar friction
Substituting this for in [11] results in
Equation [13] is, therefore, the deposition criterion for situations where . In his analysis for the case of coarse particles of narrow size distribution, Wilson (1976) suggested values of and . Similar values would be expected for fine particles and so using these values [13] reduces to
Introducing the wall shear stress this equation can be expressed alternatively as
which is identical in form to Shield's (1936) deposition criterion. Shield's value for the constant was markedly different, however, because he was concerned with incipient motion of a single particle from a stationary bed.
Alternatively, if it is assumed that particles of this size will settle according to Stokes' law,
then [14] can be re-written as,
which is somewhat similar to the deposition criterion of Thomas (1962/1 and 2).
Thus, application of the basic sliding bed equation [1] to the case ( ), when the height can be equated to the thickness of the viscous sub-layer, has resulted in a deposition criterion of the same form as Shield's and rather similar to Thomas'. This criterion, [14], does not contain particle size as a variable which is to be expected from the sliding bed concept. Note the increase in deposit velocity with increasing viscosity which is due to the increased height of the bed caused by increased .
4.3 Comparison with experimental data for unflocculated slurries
The suitability of [14] can now be assessed by comparison with experimental data. In deriving this equation the slurry pressure gradient, , in [11] was replaced by the equivalent fluid pressure gradient, . This means that [14] is strictly only applicable to low concentrations so that the influence of concentration also needs to be assessed.
In selecting data for the comparison three requirements were needed:
- The maximum particle size had to be less than .
- The particles had to be unflocculated since any flocs present would alter the representative particle size and density.
(c) The observed deposit velocity had to be greater than the velocity predicted by [6] for the maximum size particle.
This latter requirement was necessary to ensure that deposition was due to viscous sub-layer effects and not due to turbulent support effects as per [6]. This is particularly relevant to the case of fine, high density particles in which case the situation could be envisaged where although deposition could occur at a higher velocity than indicated by [14]. In such a situation the height of the sliding bed would be greater than , and be influenced by lack of turbulent support even though .
Data fulfilling these three requirements is rather scarce, only the 17 and 26 sand (Nos. 15 and 16 in table 2) being judged suitable in the present study. These two sands were tested at various additional concentrations and the results are shown plotted on figure 4. Once again the lower and upper limits indicate conditions with and without a stationary bed present respectively.
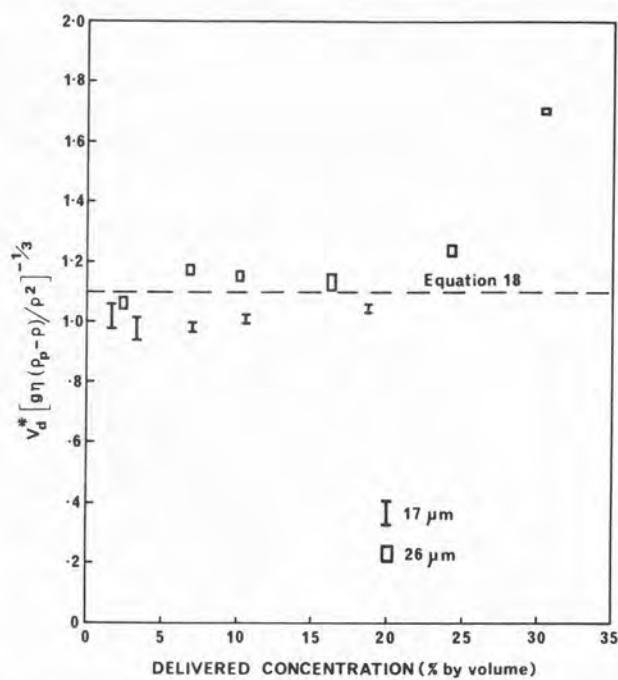
Figure 4. Viscous sub-layer deposition. Comparison between [18] and experimental results for 17 and 26 silica sand in water in a 18.9 mm pipe at various concentrations.
It can be seen that [14], with the constant increased to 1.1, correlates the data generally within up to a concentration of 20%. The value of 1.1 is remarkably close to the theoretically derived value of 0.93 although this theoretical value is by no means considered rigorously exact since it depends on the value given to the thickness of the sub-layer. This quantity, given by [8], is only an approximation for what is probably a fluctuating thickness anyway.
The final deposition criteria for is therefore:
Although this has been derived from a very limited amount of data it will be shown later how [18] is consistent with data for flocculated particles over a much wider range of variables, and, when combined with Wilson and Judge's theory, also explains much of the scatter on figure 3. Thus, indirectly, [18] will be confirmed over a considerable range of variables.
As noted previously, this equation is strictly only applicable to low concentrations since the fluid properties are employed. Because of this it could be seen at first sight surprising that it describes the situation for concentrations as high as 20%. However, the following considerations will show that this is perhaps to be expected.
An increase in concentration results in an increase in both the viscosity and the density of the slurry. From [18] it can be seen that increases in these will have opposing effects which could conceivably cancel each other out at moderate concentrations. However, as the concentration continues to be increased the viscosity will begin to increase much more rapidly than the density thus explaining the rise in the behaviour of the sand for concentrations above 20%. This type of behaviour can be obtained by use of equations for viscosity such as that proposed by Vocadlo (1976).
4.4 Range over which [18] applies
The upper limit of applicability of [18] can be obtained from figure 5 which combines the data of figures 3 and 4. This figure indicates that [18] applies up to a maximum limit of . This is considerably below the value of assumed when deriving the present theory but, as has already been mentioned, the calculated value of is not considered rigorous anyway. Thomas (1962/2) found similarly that his equation did not apply right up to . His data indicated a limiting value of around .
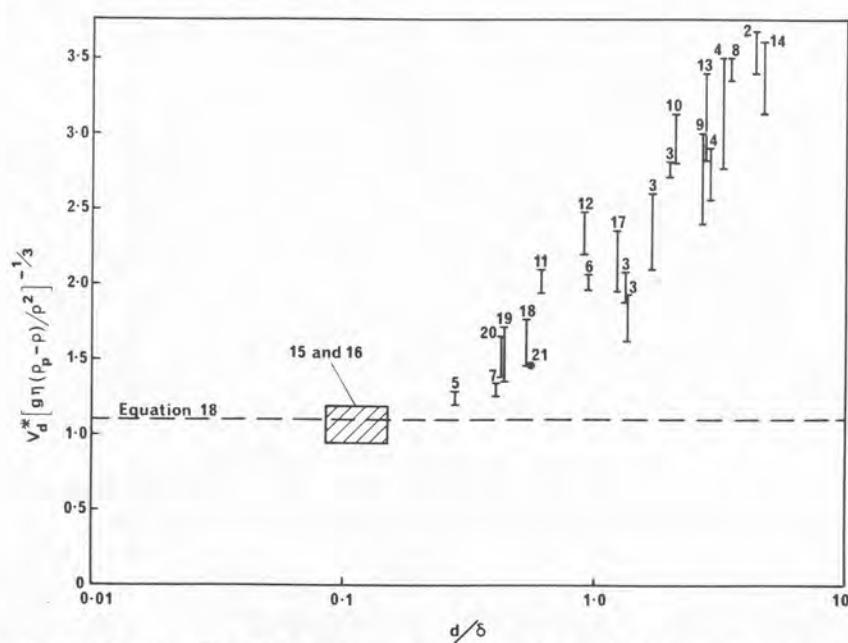
Figure 5. Limit of applicability of [18]. Numbers refer to data in tables 1 and 2. All data for concentration of 12% except data numbers 15 and 16 in which case the shaded area indicates limits for concentrations from 1.6 to 19%.
5. TRANSITION BETWEEN THE TWO TYPES OF DEPOSITION
The sliding bed theory of Wilson (1976) and Wilson & Judge (1978) which applied to coarse to medium size particles, has now been complemented by a theory of deposition for very fine particles. Whilst both theories rely on the concept of a sliding bed, the height of this bed is determined by different mechanisms in each case. In the former theory the height is determined by the degree of turbulent support whereas in the present theory the viscous sub-layer thickness determines the bed height. Intuitively one would expect a transition region between the two where the bed height is determined by both the degree of turbulent support and the thickness of
the viscous sub-layer. This would be expected to be the case for particle sizes just slightly greater than the limit of applicability of [18], i.e. for slightly greater than 0.3 . Re-considering figure 3, calculations will reveal that most of the data points for high viscosity fluids (shown ringed) which show the greatest discrepancy on this plot, are in fact for situations where is just above 0.3. Note that the observed deposit velocities for these cases always lie above the line predicted by [6]. This indicates that the height of the sliding bed is greater than that caused by lack of turbulent support. It is now postulated that in the transition region the height of the sliding bed is given by the sum of the height determined by turbulent support and the height determined by the viscous sub-layer, i.e.
where is the height determined by [6] and is the height determined by [18].
Physically, this can be justified as follows. Consider a slurry flow of fine particles at a velocity just above the deposit velocity. The lack of turbulent support will cause a certain fraction of the particles to fall to the bottom of the pipe to move as a sliding bed. But already, for particles just slightly larger than the viscous sub-layer, there will be a layer of slow moving, partly sliding particles at the wall. Therefore, the total bed height will be made up from both contributions and can be approximated by [19].
Next consider the basic sliding bed equation [1] with approximated by [9], i.e.
But as previously explained for [11], can be replaced by resulting in
i.e.
For a particular slurry , and are constants so [22] indicates
Consideration of this proportionality and [19] suggests that the deposit velocity in the transition region can be approximated by:
where denotes calculated according to [6], or the full sliding bed theory, and denotes calculated according to [18]. Note that for increasingly coarser particles the second term in [24] becomes insignificant and the equation reduces to [6]. Similarly, for very fine particles, it reduces to [18]. It needs to be emphasised at this point that all friction velocities are based on the friction factor for the equivalent discharge of clear fluid.
Figure 6 is a plot of the observed vs the predicted calculated using [24], for the data previously plotted on figure 3. The maximum error has been reduced considerably and all of the data, excepting Sinclair's (1959, 1962) iron powder results, fall within the error limits. Considering the range of variables covered by this data this is thought a reasonable correlation. Equation [24] is therefore proposed as the final deposition criterion for the complete range of particle sizes.
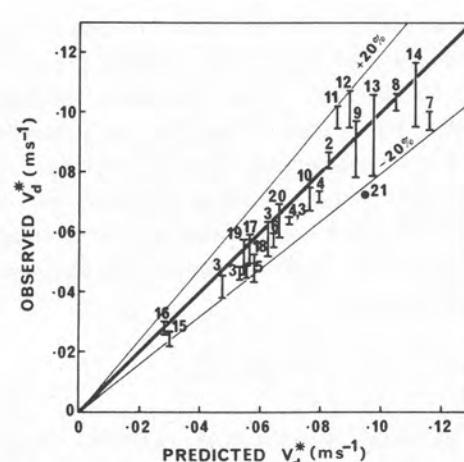
Figure 6. Combined deposition criteria. Comparison between the observed friction velocity at deposition and the predictions of [24].
6. PLOTS OF DEPOSIT VELOCITY FOR ALL PARTICLE SIZES
Plots of deposit velocity versus pipe diameter similar to figure 2 can now be drawn for all particle sizes. Figure 7 shows such a plot for particle sizes 0.50 mm and below for silica sand in 20°C water. In applying [24] the value of has been calculated using the nomograph supplied by Wilson & Judge (1978) whenever possible. For pipe sizes below 100 mm and particle sizes
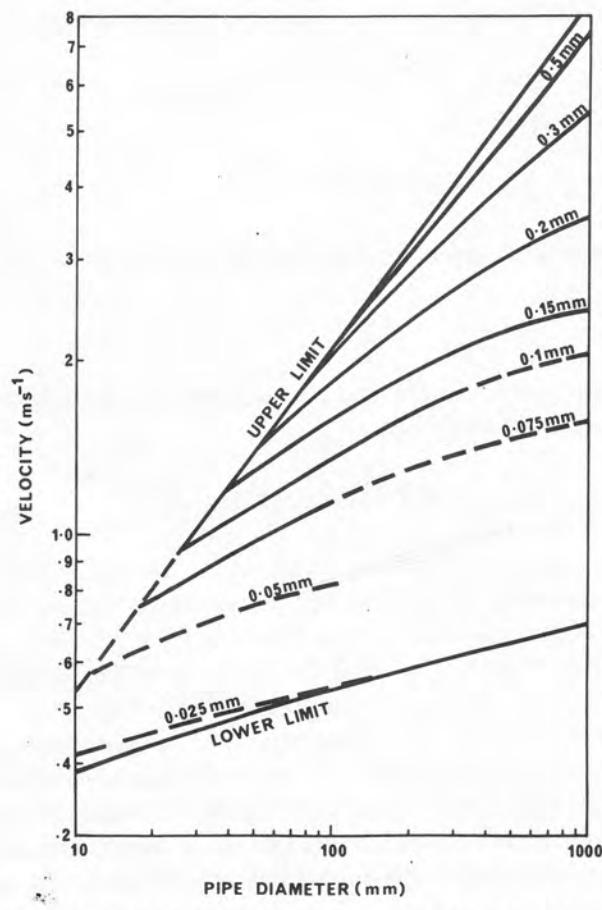
Figure 7. Predicted deposit velocity (using [24]) for various particle sizes below 0.5 mm for silica sand in 20°C water.
less than 0.15 mm [6] has been used except where the value of given by this equation is greater than the "maximum maximorum" given by Wilson & Judge (1977). Equation [6] has been used in the range but only the predictions for are shown as full lines. Comparison with figure 2 will show the present predictions to be only slightly higher than those of Wilson and Judge for particle sizes above 0.15 mm.
However, of particular interest is the lower limit to deposit velocity imposed by [18]. Thus no matter how much the particle size is reduced below 25 the deposit velocity will still be given by this lower limit. Note that this lower curve can be approximated by a straight line of slope of about 0.13 which is consistent with the gradual reduction in the slope with decreasing particle size predicted by the Wilson and Judge model.
7. EXTENSION TO FLOCCULATED PARTICLES
Equation [18] has been proposed as a deposition criterion for unflocculated particles in situations where . The form of this equation was derived from the sliding bed theory while the value of the constant was found from a limited amount of data for unflocculated particles.
It was stated previously that by assuming that the particles settle according to Stokes' law [14] could be rewritten in the form of [17]. In a similar manner [18] can be rewritten as
This equation can now be compared with the equation of Thomas (1962/2) on a plot of vs . Figure 8 is such a plot. On these coordinates the just derived limit of applicability of [18], is equivalent to and this is shown dotted. The experimental data previously used in figure 4 have been replotted on figure 8. (Ignore all other points for the present.) The size of the data points in each case indicates the range of values of all the data for better material for concentrations below 20%. It is obvious that [25] fits these two data points far better than does Thomas' equation.
However, Thomas developed his equation from data covering a considerable range of variables the best fit to the data being as indicated on figure 8. What is the reason for the apparent discrepancy? It arises because most of the data he used was for flocculated materials and in calculating and he employed the floc diameter and density. These properties of the flocs were obtained from settling tests in the quiescant state. The data he used, taken from figures 8 and 3 of his 1962/1 and 1962/2 papers respectively, are shown replotted on figure 8 with and re-calculated based on particle properties rather than floc properties. They are now seen to have been shifted to the left to follow the present theory more closely except at the largest values of . However, it is in this region, where , that the full equation, ([24]), should be employed. This can replace the lack of fit for the three data points beyond . These three points were for relatively coarse glass beads (66 and 78 ) in water and 23 coal in air, and were the only unflocculated material employed in his work. Incidentally, the data points for the glass beads indicate between 1.5 to 2 times that predicted by [25]. Consideration of figure 7, which is for material of similar density, will show that this is consistent with the predictions shown in that figure.
Returning to figure 8, the shifting of Thomas' data points over to more closely follow the present theory when the particle properties are used instead of the floc properties suggests that the floc size under conditions of turbulent pipe flow may be considerably less than that measured in settling tests where quiescent conditions prevail. Indeed Thomas (1964) himself later considered the effect of turbulent pipe flow on floc size in some detail. In that paper he concluded that flocs were disrupted by turbulence and that the floc size varies over the pipe diameter, being largest in the central core region, and smallest in the wall region. In fact, he
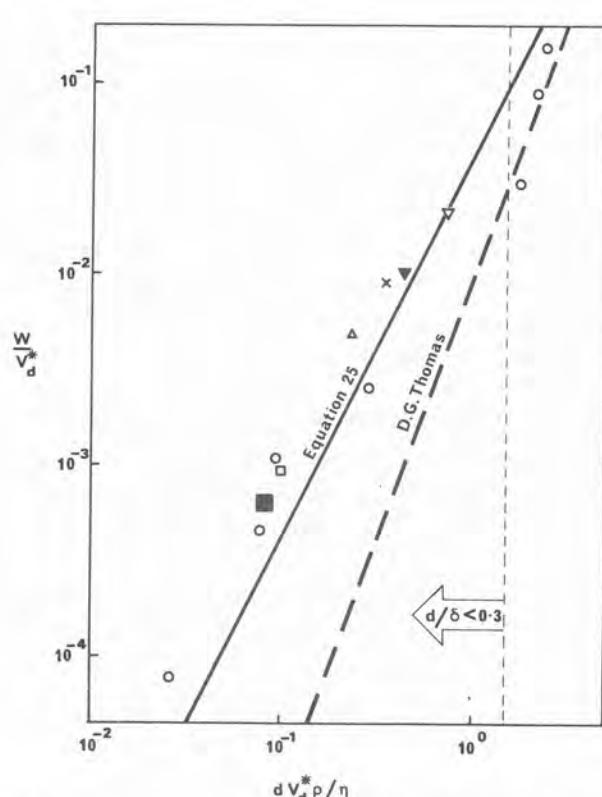
Figure 8. Comparing present viscous sub-layer deposition theory with that of Thomas (1962/2) for flocculated particles. ▼, 17 sand (15); ▽, 26 sand (16); ○, Thomas' data re-calculated using particle properties; the remaining data from Cairns et al. (1960), , 15 talc; □, 3.7 barium sulphate; ■, 2.3 lead; △, 4.8 tungsten.
states that for suspensions of micrometer size particles—"under most circumstances the suspension will be de-flocculated in the wall region immediately adjacent to the tube wall". This finding therefore supports the use of particle properties instead of floc properties in the deposition criteria. Notice, however, that the use of the particle properties instead of the floc properties seems to have over compensated and has shifted most of the data too far to the left. This suggests that in these cases there is a small degree of flocculation in the wall region. Obviously, in each case a floc size could be chosen which would force the data to fit the present theory. This floc size would, however, be much smaller than that measured under quiescant conditions.
Further evidence of this trend is supplied by the data of Cairns et al. (1960) which is also shown in figure 8. This data is from tests in four pipe sizes from 18 to 51 mm at concentrations below 4% and the size of the data points indicates the maximum variations over this range. For particle sizes such as these some flocculation could be expected. Indeed, flocculation tendencies are suggested by the reported discrepancies in the measured particle sizes between the Andreason pipette and the Micromerograph method. The latter method, which is based on the settling rate of particles in nitrogen gas, gave much smaller particle sizes than the former, water based method. The particle sizes given by the micromerograph method have been used in the present study.
Returning to the proposed deposition criterion, [18]. The effect of any flocculation tendencies in the wall region would be to cause a lower deposit velocity due to the lower density of the flocs compared to the single particles. Use of the particle density in [18] will give an upper limit to the predicted deposit velocity. The observed deposit velocity will fall increasingly below this with increasing degree of flocculation. However, these tendencies will only apply to low concentrations. For all slurries, both flocculated and dispersed, once the concentration is
increased beyond a certain limit the deposit velocity will increase for the reasons discussed at the end of section 4.3.
As an example of the use of [18] with flocculated slurries figure 9 shows the data of Cairns et al. (1960) plotted as observed deposit velocity versus pipe diameter. These can be compared with the predictions using [18]. The experimental fall some 15–35% below the predicted values is due, it is suggested, to some degree of flocculation. Note that the least discrepancy occurs for the talc, which because of its relatively large particle size, would be expected to have least flocculating tendencies. However, the most important point evident from figure 9 is the success of [18] in predicting the correct variation with pipe size. This suggests the use of [18] as a scale-up equation. For example, if the 19 mm pipe results were used in each case to obtain the constant in [18] the resulting scale-up would produce the dashed lines in figure 9, which except for the red lead, show excellent agreement with the data for the larger pipe sizes.
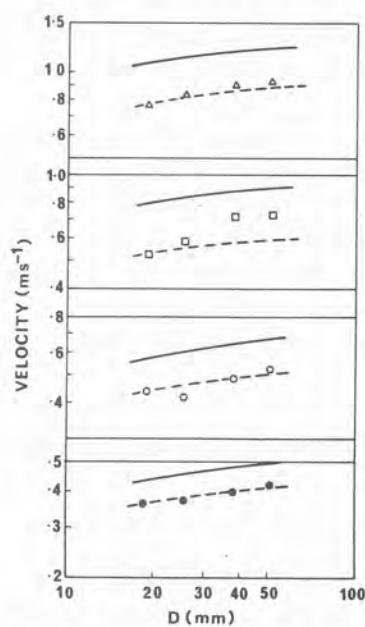
Figure 9. Comparison between predicted deposit velocity based on particle properties using [18], and experimental results of Cairns et al. (1960) for flocculated particles. Predictions shown as full lines. Dashed lines illustrate scale-up from 19 mm pipe results. ●, 15 talc; ○, 3.7 barium sulphate; □, 2.3 lead; , 4.8 tungsten.
8. APPLICATION TO WIDE PARTICLE SIZE DISTRIBUTION SLURRIES
Both the Wilson and Judge model and the present extension of that model are based on essentially mono-sized particles and all experimental data for unflocculated particles used in this paper pertains to narrow particle size distributions. However, Wilson (1976) has shown how the more normally encountered wide particle size distributions can be handled by splitting the distribution into a number of size fractions. In the case of the present viscous sub-layer extension wide size distributions present no problem since [18] does not contain particle size. However, the more complete equation [13], contains which will be greater than the assumed value of 0.6 for wide size distributions. But the absolute maximum value it can take is 1.0 which means a maximum increase in of only 18% above that predicted by [18]. For present purposes, therefore, [18], and hence also [24], can be considered applicable to all size distributions, provided the fines are not flocculated.
9. CONCLUSIONS
(a) The sliding bed theory of Wilson and Judge, as it pertains to the critical deposit velocity, has been compared with a range of pipe loop test results mostly obtained by the author. This
data covers a rather wide range of variables, particularly fluid density and viscosity, and solids density. The comparison confirmed the suitability of Wilson and Judge's theory for the relevant range of particle sizes in water , namely coarse to medium size particles having values greater than . Typically, for silica sand, this means particle sizes above about 0.10 mm.
(b) The sliding bed model has been extended to fine particles where the particle size is significantly smaller than the viscous sub-layer thickness. For silica sand in water this occurs for particle sizes below about 25 . The resulting deposition criteria, [18], is independent of particle size, thus providing a lower limit to the deposit velocity for unflocculated particles. Limited data suggest it is applicable up to concentrations of 20% by volume.
(c) For fluids of higher viscosity than water it was found that the Wilson and Judge theory did not describe the experimental results very well even for values as high as . This discrepancy has been attributed to the existence of a transition region where Wilson and Judge's theory and the present viscous sub-layer theory are both of importance. For silica sand in water this occurs for particle sizes between about 25 and 0.10 mm. The data in this region have been correlated by [24] which was derived by summing the contribution to the sliding bed height of the two theories.
(d) When flocculation tendencies are present [18] will overpredict the deposit velocity because of the lower density of the flocs compared to the discrete particles. Thomas (1962) has previously considered such slurries and used the floc size and density measured in static settling tests to develop a deposition criterion. However, it was shown that by using a floc size and density closer to the values for a discrete particle his results are consistent with the present theory. This suggests that the floc size obtained under quiescant conditions is much larger than that present in turbulent pipe flow, and should not be used to characterise deposition from such flows.
Acknowledgements —The author thanks M. D. Research Co. Pty. Ltd. for permission to publish this paper.
REFERENCES
CAIRNS, R. C., LAWTHER, K. R. & TURNER, K. S. 1960 Flow characteristics of dilute small particle suspensions. Br. Chem. Engng 849–856.
CARLETON, A. J. & CHENG, D. C. H. 1974 Design velocities for hydraulic conveying of settling suspensions. Proc. 3rd Int. Conf. on Hydraulic Transport of Solids in Pipes, Golden, Colorado, U.S.A. BHRA, Cranfield, U.K. E5/57-74.
DURAND, R. 1953 Basic relationships of the transportation of solids in pipes—experimental research. Proc. 5th Minneapolis Int. Hydr. Conv., Int. Assoc. Hydr. Res. 89–103.
HINZE, J. O. 1959 Turbulence . McGraw Hill, New York.
JUDGE, D. G. 1977 New scaling relations for the slurry pipelining of fine materials. Undergraduate Report. Dept. of Civil Eng., Queen's Univ., Kingston, Ontario, Canada.
SHIELDS, A. 1936 Application of Mechanical Similarity and Turbulence Studies of Sediment Motion , (In German). Preussische Versuchsanstalt für Wasserbau und Schiffbau, Berlin.
SHOOK, C. A., SCHRIEK, W., SMITH, L. G., HAAS, D. B. & HUSBAND, W. H. W. 1973 Experimental studies on the transport of sands in liquids of varying properties in 2 and 4 inch pipelines. Report E73-20, Saskatchewan Research Council, Canada.
SINCLAIR, C. G. 1962 The limit deposit-velocity of heterogeneous suspensions. Proc. Symp. on the Interaction between Fluids and Particles, London, Institution of Chem. Engineers. 78–86.
SINCLAIR, C. G. 1959 The pipe flow properties of suspensions of high density solids. Ph.D. Thesis, University of Sydney, Australia.
THOMAS, A. D. 1977 Particle size effects in turbulent pipe flow of solid-liquid suspensions. Proc. 6th Australasian Hydraulic and Fluid Mechanics Conf. Adelaide, Dec. 113–116.
THOMAS, D. G. 1962/1 Transport characteristics of suspensions: Part II, Minimum transport velocity for flocculated suspensions in horizontal pipes. A.I.Ch.E.J. 7 , 423-430.
THOMAS, D. G. 1962/2 Transport characteristics of suspensions: Part VI, Minimum transport velocity for large particle size suspensions in round horizontal pipes. A.I.Ch.E.J. 8 , 373-378.
THOMAS, D. G. 1964 Turbulent disruption of flocs in small particle size suspensions. A.I.Ch.E.J. 10 , 517-523.
VOCADLO, J. J. 1976 Role of some parameters and effective variables in turbulent slurry flow. Proc. 5th Int. Conf. on Hydraulic Transport of Solids in Pipes, Banff, Alberta, Canada. B.H.R.A., Cranfield, U.K. D4/49-61.
WILSON, K. C. 1976 A unified physically-based analysis of solid-liquid pipeline flow. Proc. 4th Int. Conf. on Hydraulic Transport of Solids in Pipes, Banff, Alberta, Canada. B.H.R.A., Cranfield, U.K. A1/1-16.
WILSON, K. C. 1974 Co-ordinates for the limit of deposition in pipeline flow. Proc. 3rd Int. Conf. on Hydraulic Transport of Solids in Pipes, Golden, Colorado, U.S.A. B.H.R.A., Cranfield, U.K. E1/1-14.
WILSON, K. C. 1972 A formula for the velocity to initiate particle suspension in pipeline flow. Proc. 2nd Int. Conf. on Hydraulic Transport of Solids in Pipes, Coventry, England. BHRA, Cranfield, U.K. E2/23-36.
WILSON, K. C. 1970 Slip points of beds in solid-liquid pipeline flow. Proc. A.S.C.E. 96 , 1-12.
WILSON, K. C. & JUDGE, D. G. 1976 New techniques for the scale-up of pilot plant results to coal slurry pipelines. The Int. Symp. on Freight Pipelines, Washington D.C., U.S.A. Dec. Uni of Penn., Phil., U.S.A.
WILSON, K. C. & JUDGE, D. G. 1977 Application of analytic model to stationary-deposit limit in sand-water slurries. Proc. 2nd Int. Symp. on Dredging Technology, Texas, U.S.A. B.H.R.A., Cranfield, U.K. J1/1-12.
WILSON, K. C. & JUDGE, D. G. 1978 Analytically based nomographic charts for sand water flow. Proc. 5th Int. Conf. on Hydraulic Transport of Solids in Pipes, Hannover, Germany. B.H.R.A. Cranfield, U.K. A1/1-12.
WILSON, K. C., STREAT, M. & BANTIN, R. A. 1972 Slip model correlation of dense two phase flow. Proc. 2nd Int. Conf. on Hydraulic Transport of Solids in Pipes, Coventry, England. B.H.R.A., Cranfield, U.K. B1/1-10.
WILSON, K. C. & WATT, W. E. 1974 Influence of particle diameter on the turbulent support of solids in pipeline flow. Proc. 3rd Int. Conf. on Hydraulic Transport of Solids in pipes, Golden, Colorado, U.S.A. B.H.R.A., Cranfield, U.K. D1/1-10.
APPENDIXEXPERIMENTAL PIPE LOOPSFour pipe loops were used with internal pipe diameters of 9.41, 18.9, 53.8 and 105 mm. All were conventional recirculating types involving straight horizontal lengths of smooth pipe m long in the case of the two smaller pipes and m in the case of the two larger pipes. The presence of a stationary bed was detected by visual inspection through clear sections of pipe. The mean velocity of flow was obtained by diverting the flow and measuring the time taken to fill a known volume. The estimated maximum error involved in velocity determination was 3%. The weight of this volume of slurry was also measured enabling the delivered concentration of solids to be determined.
The high viscosity tests used sugar/water solutions of various concentrations the viscosity being determined with a Brookfield rotational viscometer.