This HTML edition contains selectable text extracted from the original PDF. Layout-aware OCR was used to recover reading order, figures and equations; minor recognition errors may remain. Consult the PDF for the authoritative layout, figures and equations.
Turbulent Pipe Flow of Bingham Plastics
A.D. THOMAS
Consulting Engineer, Hilldale, Newcastle, N.S.W. 2420
1. INTRODUCTION
When the particles in a slurry are either wholly or partly colloidal in size, say less than 10 microns, the slurry will generally behave as a Bingham plastic. For such slurries it should be possible to perform bench scale viscometer tests. The problem then becomes one of predicting the pipeline behaviour from the laminar rheological properties. The laminar flow behaviour in any pipe can be obtained with relative ease but when it comes to turbulent flow prediction the situation is not so straight forward. There have been numerous theories advanced but none is entirely satisfactory. Indeed as recently as last year Techchandani & Shook (1) stated that "prediction of turbulent pipe flow behaviour is not yet an exact science".
One theory which has achieved some prominence is that due to Hanks & Dadia (2) and more recently Hanks (3). The present paper critically examines this theory by comparing it with a range of data. An unusual approach is taken whereby a distinction is made between those slurries having all colloidal sized particles, e.g. clay slurries; and those having both colloidal sized and coarser particles, e.g. coal slurries.
2. FULL COLLOIDAL SLURRIES
Early workers (4, 5, 6,) found that the turbulent flow data were correlated by the Reynolds number indicating that the yield stress had little or no influence. More recently Cheng (7) and Vocadlo (8) reached the same conclusions. Russian workers apparently agree also ((9), page 161) and ((10), page 88). All of the above found that when the plastic viscosity was used in the Reynolds number the friction factors plotted parallel to but generally below the Newtonian line.
A very comprehensive series of tests were performed by Thomas (11, 12) who found that all of his data were correlated by the Reynolds number but that the friction factor - Reynolds number relationship had a different slope than the Newtonian line. This slope depended on the degree of non-Newtonian behaviour as measured by either the yield stress or the plastic viscosity and was increasingly less negative than the Newtonian line as the yield stress increased. If data from any one pipe size are assumed to parallel the Newtonian line this means in effect that there is an additional pipe diameter effect over and above that due to the Reynolds number. Thomas' correlation also indicates that for any given Reynolds number the friction factor falls increasingly below the Newtonian line as the yield stress increases. Thus in contrast to workers before him Thomas was in effect saying that both the yield stress and the pipe diameter were important in addition to the influence of Reynolds number.
A convenient method of studying the problem is to plot versus . Here is the observed friction factor and is the calculated value if the slurry is assumed to behave as a Newtonian fluid of viscosity equal to the plastic viscosity. is the yield stress. Fig. 1 is such a plot for a range of data (4, 11, 12, 13, 14, 15, 16, 17). The numbers beside some data points indicate pipe diameters in mm. Two things are obvious. Firstly there is a gradual reduction in as increases in agreement with Thomas' (11, 12) conclusions. Secondly a slight pipe diameter effect is apparent with increasing as the pipe size increases once again in agreement with Thomas. A study of this pipe diameter dependence shows that it is more pronounced at lower yield stress values becoming zero and indeed slightly negative at very high yield stresses. Industrial slurries very rarely have a yield stress greater than 30 Pa. For data below this the increase in is roughly proportional to . the variation of with yield stress is approximated by the drawn line.
In 1971 Hanks & Dadia (2) published a theory of Bingham plastic flow in which it was assumed that the turbulent behaviour depended on both the Reynolds number and the Hedstrom number, , given by
where is the pipe diameter, is the density and is the plastic viscosity.
More recently Hanks (3) has modified the theory slightly in the light of additional data. This theory indicates that the friction factor almost parallels the Newtonian line but that the position below that line depends on the Hedstrom number rising closer to it as He increases. From (3) it is possible to plot his predicted variation in with He. Fig. 2 is such a plot for the Reynolds number replotted on Fig. 2 as versus He. The numbers beside some data points indicate yield stress in Pascals.
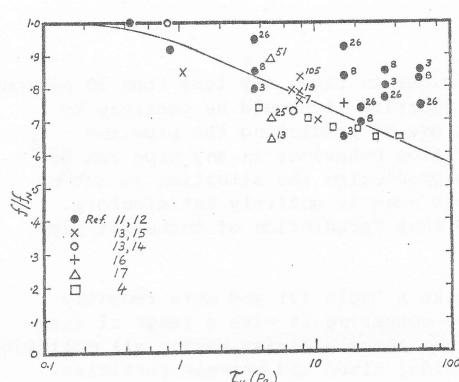
Figure 1: Variation of with yield stress for colloidal slurries.
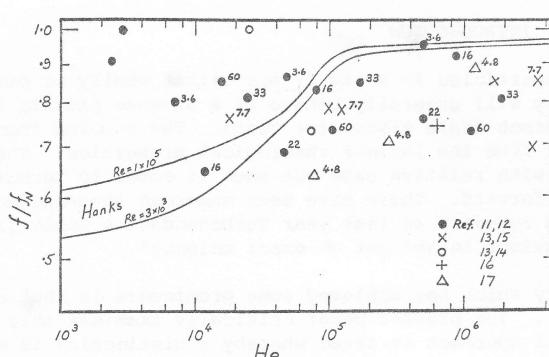
Figure 2: Variation of with Hedstrom number for colloidal slurries.
It is obvious that Hanks' theory describes this data very poorly. The main reason for this is due to the role of the yield stress. Consider tests on different slurries in a single pipe size. For constant pipe diameter He depends on . For any particular colloidal slurry this parameter measures fairly constant for all concentrations and hence yield stress values (it is in fact a progressively decreased He will at first remain constant and then also slowly decrease. Hence at best Hanks' theory predicts a constant value of as decreases when in fact Fig. 1 shows that increases. More fundamentally as is decreased to very low values He decreases and his theory predicts a lowering of as it is shown in Fig. 1.
Next consider data for a particular slurry ( constant) in different pipe sizes. In this case He increases as D increases. Consideration of Figs. 2 indicates the data for varying pipe sizes do in fact show an increase in as He increases. Hanks' theory predicts such an increase at least for He below . Thus his theory does predict the correct trend as far as pipe diameter is concentrated, although it appears to overestimate the effect. For example, in the range to increases roughly as , i.e. increases as , greater than the discussed in relation to Fig. 1.
Thus it has been seen how for colloidal slurries Hanks' theory does not describe the effect of yield stress but does describe the pipe diameter effect although possibly an exaggerated degree. This latter point will be returned to in the following discussion on coarser slurries.
3. COARSER SLURRIES
These slurries are those having only some of the particles colloidal in size with the rest ranging sometimes up to mm size. Fig. 3 shows an analogous plot to Fig. 1 for this type of slurry with the data taken from Refs. 13, 14, 18, 19, 20, 21, 22 & 23. Numbers beside data points indicate pipe diameter in mm. Once again a general reduction in as increases is evident. The full line allows comparison with colloidal slurries, (Fig. 1). Consideration of the data for different pipe sizes shows that there is less influence of pipe diameter except for the loam data which show a very pronounced effect. Plotting of the data as versus He (Fig. 4) indicates even more scatter than occurred with colloidal slurries (Fig. 2). This Figure numbers beside data points indicate yield stress in Pascals. Note however that the pipe diameter effect observed with the loam, is identical to the Hanks prediction. An interesting observation is that unlike colloidal slurries does not appear to influence this effect but particle size does. To study this effect more closely more data is needed but available data for coarser slurries where the yield stress has been measured is very limited. Fortunately there is an alternative means of studying this without requiring a knowledge of the yield stress. This is as follows. If a particular slurry has been tested in a number of different pipe sizes a plot of versus D will reveal the existence or otherwise of a diameter effect. Here J is the slurry pressure gradient and J is the pressure gradient for water at the same velocity. If there is no pipe diameter effect will be essentially independent of D but if there is an effect will alter with D. Actually, because of the change in slope of the friction factor - Reynolds number plot with increasing Reynolds number, would be expected to show a slight negative dependence even for a Newtonian fluid e.g. for a viscosity of Pas would vary roughly as . On the other hand according to the observation of Fig. 3
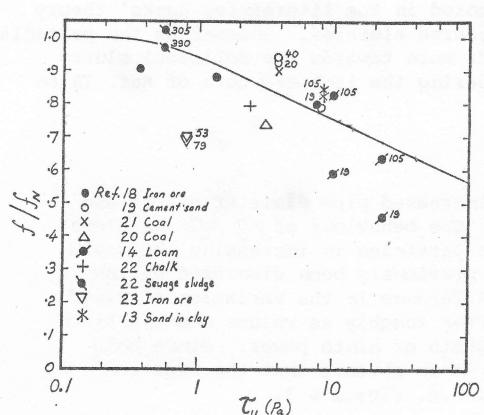
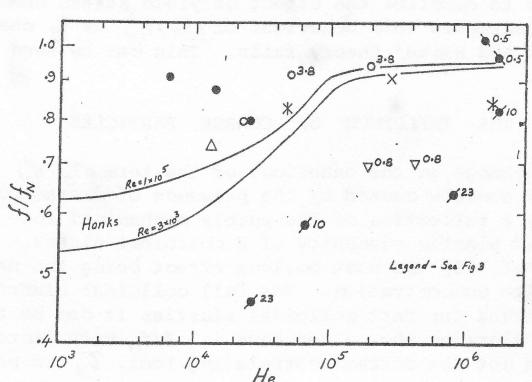
Figure 3: Variation of with yield stress for coarser slurries.
Figure 4: Variation of with Hedstrom number for coarser slurries.
coarse particle slurries could be expected to show a positive dependence on , e.g. the two sets of loam data of Fig. 3 indicate that is proportional to and .
There is a large body of data which can be used in this manner to study this effect. Fig. 5 shows some available data from a range of sources (24, 25, 26, 27) plotted as versus . The slopes of lines drawn through each set of data have been measured and shown in Fig. 6 plotted against the median particle size. The slope is seen to be tending below zero for fine particles but rising up to around +0.20 for coarser slurries. It is apparent from Fig. 6 that the influence of pipe diameter increases sharply as the median particle size increases from 30 to 100 microns. Thus, whereas with colloidal slurries the yield stress influenced the pipe diameter effect, for these coarser slurries particle size appears to be the controlling parameter. None of the published theories of Bingham plastic flow include particle size as a parameter so none would be expected to fully describe the behaviour of these slurries.
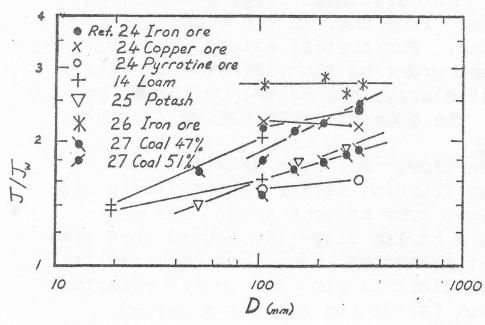
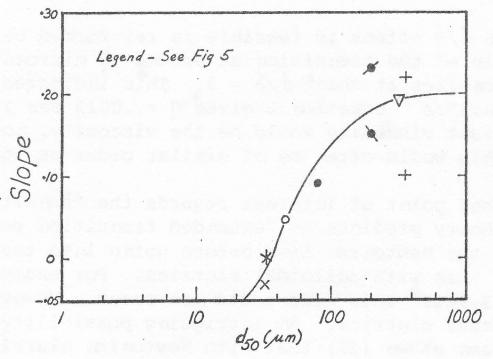
Figure 5: Variation of with pipe diameter for coarser slurries.
Figure 6: Change in pipe diameter dependence with median particle size for coarser slurries.
For the coarsest slurries having median particle sizes above 200 microns, the dependence of on is much greater than was the case with colloidal slurries ( c.f. ). Russian workers are apparently aware of this strong pipe diameter effect since for coal slurries they claim that the effective viscosity increases directly with pipe size ((9), page 161, (10), page 170). This would mean that would vary roughly as the exponent depending slightly on the Reynolds number. This is therefore in agreement with Fig. 6. Fig. 6 is an improvement however since it describes the transition as the particle size becomes finer.
From the above discussion it is clear that the Hanks theory more correctly describes the pipe diameter effect for the coarsest slurries ( ) than for either the full colloidal slurries ( ) or for the finest part colloidal slurries ( ). Obviously Thomas' (11, 12) correlation will not describe these coarser slurries since it correlated only data for which .
Regarding the effect of yield stress. For colloidal slurries it was noted how the term remains either constant or decreases as decreases. Such is not the case for coarser slurries for which this term tends to increase as decreases. Thus will increase as increases,
more in keeping with Hanks' theory. This can be seen by considering the two sets of loam data in the same pipe size on Fig. 4. Because of this difference in the rheological behaviour of colloidal and coarse slurries which hitherto appears to have been overlooked in the literature, Hanks' theory will tend to describe the behaviour of yield stress changes for coarse slurries. However as the particle size is decreased this behaviour of as changes tends more towards the colloidal slurry situation and Hanks' theory fails. This can be seen by considering the iron ore data of Ref. 18 on Figure 4.
5. THE INFLUENCE OF COARSE PARTICLES
Both the change in the behaviour of the term , and the increased pipe diameter effect are obviously somehow caused by the presence of coarse particles. The behaviour of is almost certainly a reflection of the purely mechanical role of coarse particles in increasing the yield stress and plastic viscosity of a colloidal slurry. This has previously been discussed by the author (Ref. 15) the most obvious effect being the dramatic difference in the variation of yield stress with concentration. For full colloidal slurries varies roughly as power. Concentration cubed with concentration colloidal slurries the eighth or ninth variation power. Since both types of slurries show a decrease in with increasing it is obvious that the Hedstrom number is not the correct correlating tool. is preferable, e.g. Figs. 1 & 3.
The cause of the pipe diameter effect is not so obvious but it is possible that it is due to a viscous sub-layer effect dependent on particle size. Such an effect is generally recognized as occurring with Newtonian fluids, the behaviour being different depending on whether the particle size is smaller or larger than the viscous sub-layer - (28, 29, 30). Thomas (13) showed that this effect also occurred when the carrier fluid was non-Newtonian. In Ref. 30 a graph is given showing the variation of (for silica sand slurries) with where is the thickness of the viscous sub-layer given by
is the friction velocity.
From this graph it can be inferred that for the highest concentration tested, 30% by volume, varies approximately inversely with . Now for a Newtonian fluid varies roughly as so that should vary as . This is consistent with the finding from the coarsest slurries. As the concentration increases Ref. (30) indicates a greater dependence on so that the exponent of would be expected to increase with concentration. This does in fact occur as can be seen from the coal data (27) of Fig. 5.
That this effect is feasible is reinforced by the following calculations. Fig. 6 indicates the middle of the transition at around 70 microns particle sizes. From Ref. 30 the middle of the transition lies at about . This indicates varies roughly as so that will be equation 2 gives Pas i.e. of the same order as the viscosity of water. The relevant viscosity would be the viscosity, not of the total slurry, but of the colloidal portion only. This would often be of similar order as that of water. The concept is therefore feasible.
One further point of interest regards the transition to laminar flow. For high Hedstrom numbers Hanks' theory predicts an "extended transition region" with the friction factor rising slowly and crossing the Newtonian line before going into the laminar region. The present author has not observed this with colloidal slurries. For example tests with a kaolin clay (15) showed that even at this effect did not occur. However the present author has sometimes observed it with coarser slurries. An intriguing possibility is that this effect is also due to effects. It has been shown (28) that with Newtonian slurries the friction factor can exhibit a marked, gradual rise above the Newtonian line as the velocity is decreased when the particle size is of the same order as . If conditions were such that this effect occurred at velocities just above laminar flow it could be mistaken for an extended transition region.
4. CONCLUSIONS
It has been shown that for Bingham plastics the turbulent flow behaviour, as measured by , depends on both the yield stress and the pipe diameter. For both colloidal sized and coarser slurries decreases as increases. For colloidal slurries is also roughly proportional to whilst for the coarsest slurries (median size above 200 microns) it varies as . For intermediate particle sizes the exponent ranges between +.2 and zero. Hanks' theory was shown to roughly predict the correct trends for the coarsest slurries as regards the effect of and although with often large absolute errors. However for progressively finer slurries it was shown to increasingly overpredict the effect of and to predict the reverse trend as regards . This latter reversal reflects the different behaviour of the term for the two types of slurries as the concentration is changed which hitherto does not appear to have been noted in the literature.
For coarser slurries it has been postulated that the ratio of particle size to viscous sub-layer thickness is important. In postulation that the ratio of particle size to viscous sub-layer must include particle size as well as the rheological parameters. Much further work is obviously required to clarify the situation. In the interim the use of instead of Hedstrom number to correlate data appears preferable especially if additional allowance is then made for the effect of pipe diameter.
REFERENCES- 1. TECHCHANDANI, N., SHOOK, C.A., Jnl. of Pipelines , 2, 43 (1982)
- 2. HANKS, R.W., DADIA, B.H., A.I.Ch.E.Jnl. , 17, 3, 554 (1971)
- 3. HANKS, R.W., Hydrotransport 5 Conf. , BHRA, paper C2, (1978)
- 4. CALDWELL, D.H., BABBITT, H.F., Ind. Eng. Chem. , 33, 249 (1941)
- 5. ALVES, G.E., et al, Chem Eng. Progress , 48, 385 (1952)
- 6. HEDSTROM, B.O.A., Ind. Eng. Chem. , 44, 651 (1952)
- 7. CHENG, D.C.-H, Hydrotransport 1 Conf. , BHRA, paper J5 (1970)
- 8. VOCADLO, J.T., Hydrotransport 4 Conf. , BHRA, paper D4 (1976)
- 9. TRAYNIS, V.V., Parameters and Flow Regimes for Hydraulic Transport of Coal by Pipelines , Terraspace, Rockville, Md., U.S.A.(1977)
- 10. SMOLDYREV, A.Y., SAFANOV, Y.K., Pipeline Transport of Concentrated Slurries , Terraspace, Rockville, Md., U.S.A. (1979)
- 11. THOMAS, D.G., A.I.Ch.E. Jnl. , 6, 4, 631 (1960)
- 12. THOMAS, D.G., A.I.Ch.E. Jnl. , 8, 2, 266 (1962)
- 13. THOMAS, A.D., Hydrotransport 5 Conf. , BHRA, paper D5 (1978)
- 14. THOMAS, A.D., Proc. 4th Int. Tech. Conf. on Slurry Transport , 196 Slurry Transport Assoc., U.S.A. (1979)
- 15. THOMAS, A.D., 2nd National Conf. on Rheology , Sydney (1981)
- 16. HISAMITSU, N., et al, Hydrotransport 5 Conf. , paper D3, BHRA (1978)
- 17. KENCHINGTON, J.M., Hydrotransport 5 Conf. , paper D7, BHRA, (1978)
- 18. STEVENS, G.S., CHARLES, M.E., Hydrotransport 2 Conf. , paper E3, BHRA (1972)
- 19. WILHELM, R.H., et al, Ind. Eng. Chem. , 31, 5, 622 (1939)
- 20. DUCKWORTH, R.A. et al, 4th Int. Symp. on Freight Pipelines , Atlantic City, N.J., U.S.A. (1982)
- 21. RIGBY, G.R., et al, Hydrotransport 8 Conf. , BHRA (1982)
- 22. WASP., E.J., et al, Hydrotransport 1 Conf. , paper H4, BHRA (1970)
- 23. CHENG, D.C.-H., WHITTAKER, W., Hydrotransport 2 Conf. , paper C3, BHRA (1972)
- 24. KARASIK, V.M. et al, Slurry Hydrotransport of Minerals and Tailings , Terraspace, Rockville, Md., U.S.A. (1979)
- 25. SMITH, L.G. et al, Experimental Studies on the Hydraulic Transport of Potash , Saskatchewan Research Council, Canada (1973)
- 26. SCHRIEK, W. et al, Experimental Studies on the Hydraulic Transport of Iron Ore , Saskatchewan Research Council, Canada, (1973)
- 27. SCHRIEK, W., et al, Experimental Studies on the Hydraulic Transport of Coal , Saskatchewan Research Council Canada (1973)
- 28. MAUDE, A.D., WHITMORE, R.L., Trans. Instn. Chem. Engrs , 36, 296 (1958)
- 29. DAILY, J.W., ROBERTS, P.R., TAPPI , 49, 3, 115 (1966)
- 30. THOMAS, A.D., Proc. 6th Australasian Hydraulics and Fluid Mechanics Conf. , 113, I.E. Aust. (1977)