This HTML edition contains selectable text extracted from the original PDF. Layout-aware OCR was used to recover reading order, figures and equations; minor recognition errors may remain. Consult the PDF for the authoritative layout, figures and equations.
New Analysis of Non-Newtonian Turbulent Flow — Yield-Power-Law Fluids
A. D. THOMAS
Consulting Engineer, Newcastle, N.S.W., Australia
and
K. C. WILSON
Department of Civil Engineering, Queen's University, Kingston, Ontario, Canada K7L 3N6
The writers' new analysis of non-Newtonian turbulent flow is extended to the yield-power-law model. As the value of the exponent of the yield-power law decreases from unity, the calculated friction factor begins by converging toward the Newtonian line at high velocity, then parallels it, and finally diverges downward. This prediction agrees with previously unexplained experimental results.
L'analyse originale, que font les auteurs, de l'écoulement turbulent non-newtonien est étendue au modèle de la loi de puissance avec seuil décroit à partir de la valeur une, le facteur de friction calculé commence par converger vers la droite newtonienne à haute vitesse, puis suit parallèlement cette ligne pour finalement diverger vers le bas. Cette prédiction est en accord avec des résultats expérimentaux qui n'ont pu être expliqués antérieurement.
Keywords: turbulence, non-Newtonian flow, yield-power-law slurries, slurry pipelines.
In a recent paper (Wilson and Thomas, 1985) a new analysis of the turbulent flow of non-Newtonian fluids was presented. Based on enhanced micro-scale viscosity effects, the analysis predicts a thickened viscous sub-layer, with consequent increased throughput velocity and reduced friction factor. The analysis indicates that the thickness of the viscous sub-layer is proportional to the area ratio , defined as the ratio of the area under the non-Newtonian rheogram to that for a Newtonian fluid with the same strain rate and wall shear stress. As these areas can be obtained from the rheogram there is no necessity for a rheological model to be fitted. However, a model is often convenient, especially when extrapolation of the rheogram is necessary. In the previous paper the theory was applied to two-parameter formulations — the power-law and the Bingham-plastic model. It is now extended to a three-parameter case — the yield-power-law model (Also known as the Herschel-Bulkley model).
Application of the analysis to the yield-power-law model
The equation which defines yield-power-law rheological behaviour is
where is shear stress, is yield shear stress and is velocity gradient. For this model it is found that the area ratio is given by
where , with representing the shear stress at the pipe wall. It can be seen that when , Equation (2) reduces to , which is the relation for a Bingham
fluid. On the other hand, for it reduces to , which is the relation for a power-law fluid.
The effect of the predicted thickening of the viscous sub-layer with is to increase the throughput velocity (for a given shear velocity ). This effect is expressed by Equation (10) of Wilson and Thomas (1985)
In this equation represents the throughput velocity for an equivalent Newtonian flow, i.e. flow with the same wall shear stress, , for a Newtonian fluid with viscosity which corresponds to the non-Newtonian value at shear stress . It should be noted that is the "secant" viscosity, i.e. . The area ratio , now calculated by Equation (2), is also evaluated at .
The final term, , of Equation (3) gives the effect on throughput velocity of any blunting of the velocity profile in the core of the flow caused by the presence of a yield stress in non-Newtonian fluids. It was proposed (Wilson and Thomas, 1985) that depends only on the stress ratio , and can reasonably be approximated by the expression
Note that the plus sign in this equation wrongly appeared as a minus sign in Wilson and Thomas (1985).
Comparison with experimental results
Figure 1 shows laminar-flow rheograms for kaolin clay slurries (Thomas, 1981), based on data obtained in a 7.2 mm diameter tube viscometer by Tuft (1977). As noted by Thomas (1978), other tests in this tube viscometer using clays from the same source showed excellent agreement with
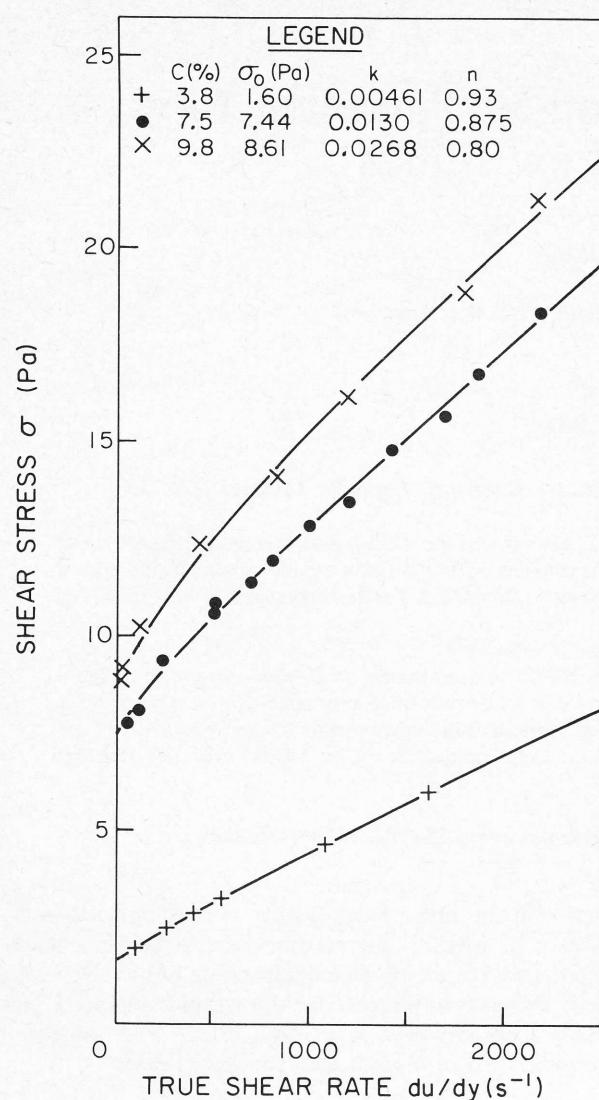
Figure 1 — Rheograms for kaolin slurries at various concentrations.
laminar flow data from recirculating pipe systems with internal diameter 18.9 mm and 105 mm. Specifically there was no indication of the ‘slip’ effects sometimes reported for rheological tests of clay slurries. In the previous paper (Wilson and Thomas, 1985) the slurry with 7.5% clay was analysed as a Bingham plastic ( ), but it can be seen that a yield-power-law model with fits the data better. (Correlation coefficient 0.9983 cf. 0.9971 for a Bingham model.)
Figure 2 shows turbulent-flow behaviour predicted by Equation (3) for the 7.5% kaolin slurry in two pipe sizes, 18.9 mm and 105 mm. The experimental data obtained by Thomas (1981) for these pipe sizes have also been plotted on the figure. The Reynolds number used for this figure is based on the viscosity , evaluated at . The turbulent-flow data are in better agreement with the yield-power-law prediction, , than with the prediction of the Bingham model. Note that for such a value of the yield-power-law prediction shows less rapid convergence towards the Newtonian line than does the Bingham ( ) prediction.
It was noted above that for the kaolin clay slurry at 7.5% concentration by volume, a yield-power-law model
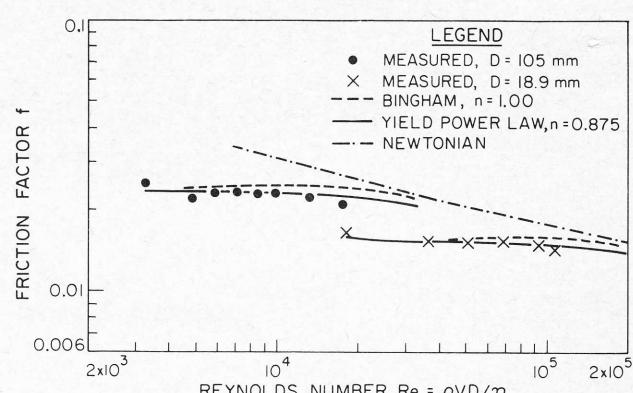
Figure 2 — Turbulent-flow friction factor for slurry of 7.5 percent kaolin.
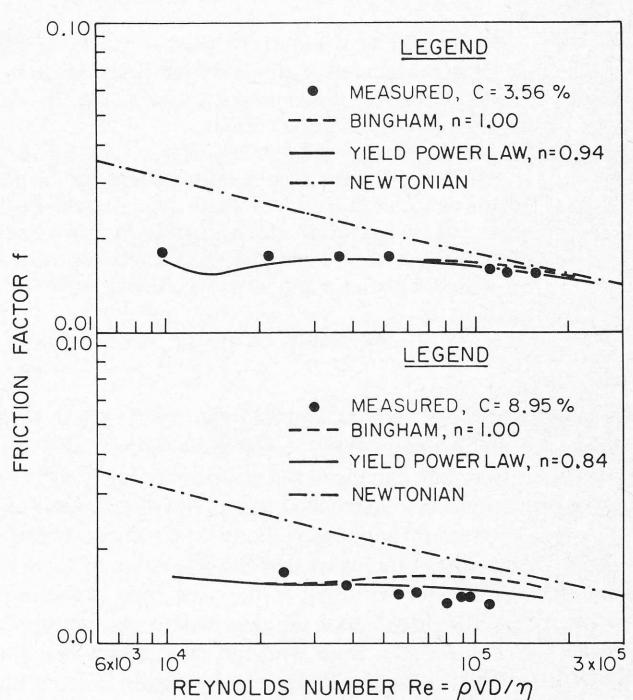
Figure 3 — Turbulent-flow friction factors for slurries of 3.56 and 8.95 percent kaolin in 105 mm pipe.
with is most appropriate. The same material was tested at other concentrations by Tuft (1977), and Figure 1 also shows plots based on his tube viscometer data for concentrations 9.8%, and 3.8%. The yield-power-law curves for these slurries which are shown on Figure 1 represent the best fit as determined by linear regression (with the value of selected at intervals of 0.01). It can be seen that the concentration affects the parameters of the yield-power-law, with the best-fit value of decreasing with increasing concentration; and it is suggested that this behaviour is typical of many slurries.
Slurries of the same kaolin clay were tested by Thomas (1977) at a number of different concentrations in the 105 mm pipe with turbulent flow conditions. Figure 3 shows the predictions of the present theory for two concentrations — 3.56% and 8.95% by volume. The appropriate yield-power-law parameters were found by interpolation from the three values already discussed in connection with Figure 1. Also shown, as dashed lines, are the predictions of the present theory using the Bingham model. For the lower concentration
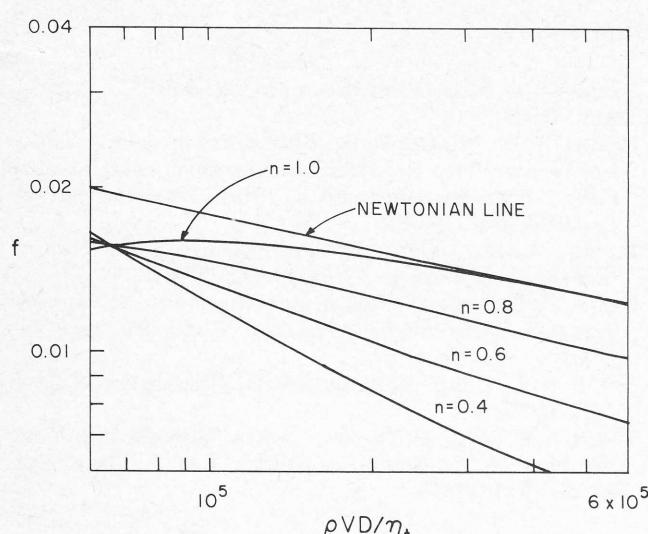
Figure 4 — Predicted turbulent-flow friction factors for numerical example.
slurry the predictions using the yield-power-law and the Bingham models are similar — both showing a maximum error of about 6%. In the case of the higher-concentration slurry the difference between the two predictions is more pronounced, with the yield-power-law prediction following the data more closely, having a maximum error around 10%. It can be seen that the higher-concentration data tend to converge to the Newtonian line with increasing Reynolds number, whereas for the higher-concentration slurries the trend of the data remains significantly below the Newtonian line, approximately paralleling it. If the friction factor is plotted against the plastic Reynolds number (based on the ‘tangent’ viscosity ), the difference in trends between the two concentrations becomes even more evident.
The nature of the trends can best be shown by numerical example. Suppose for this purpose that the rheogram for range of Newtonian say near , for which and the ‘tangent’ viscosity . A series of yield-power-law rheologic relations can be fitted to these data, corresponding to various values of in Equation (1). For this type of problem, once has been selected the corresponding values of and can be calculated. The meaningful range of in this case is from unity (Bingham plastic with ) to (power-law fluid with of zero).
With the limited data postulated above, a material of this type would probably be treated as a Bingham plastic, using the plastic Reynolds number based on the value of near . For , and using , the results are shown on Figure 4, which is a plot of turbulent-flow friction factor versus the plastic Reynolds number. As expected, the Bingham-plastic line (calculated according to the present theory and marked on the figure) lies below the line of Newtonian behaviour, but rises rapidly to converge with the Newtonian line. If, however, the assumed Bingham relation is not the true one, and the actual value of is significantly less than 1.0, the predicted behaviour is different, as shown on Figure 4. Note that the points for the various values of pass through this point. The prediction for lies approximately parallel to the Newtonian line, whilst that for (and
for , corresponding to the power law for the present example) diverge downward with increasing plastic Reynolds number (as before, the plastic Reynolds number is based on the ‘observed’ tangent viscosity of ).
It may be noted in particular that for the curvature of the rheogram is modest, and the yield stress of is not greatly different from the ‘Bingham’ value of . In such a case the approximation using the Bingham model would normally appear quite appropriate, but the present analysis shows that the behaviour of the turbulent-flow friction factor could be strongly affected. As noted previously, the exponent of the yield-power-law rheogram has a tendency to increase with increasing solids concentration. The analysis indicates that this would result in a change of behaviour with increasing concentration — from converging towards the Newtonian line to paralleling it, or even diverging. This prediction is in full accord with the behaviour noted above in connection with Figure 3. Agreement is also found in the work of D. G. Thomas (1963), who noted a similar change in behaviour with increasing concentration for slurries of kaolin and thorium oxide, including downward divergence from the Newtonian line in some cases.
It would appear that an answer has now been provided to the question raised in the previous paper (Wilson and Thomas, 1985), as to why data for some slurries with a yield point tend to converge towards the Newtonian line whilst other data more nearly parallel it. It is now seen that at low concentrations the Bingham model is reasonably appropriate (with consequent convergence towards the Newtonian line), but as the concentration is increased the advantages of yield-power-law model become more significant.
Conclusion
The recent theory of Wilson and Thomas (1985) has been extended to the case of the yield-power-law model. The predictions using this model show a change in behaviour as the exponent decreases. For the plot of friction factor versus plastic Reynolds number converges towards the Newtonian line, but as is decreased to around 0.8 the predicted curve lies below the Newtonian line and essentially parallel to it. Further lowering of causes divergence downward from the Newtonian line. For the clay slurries tested it was shown that decreases as the solids concentration is increased. This implies that the predicted change in turbulent behaviour — from convergence through paralleling to eventual divergence — will take place as the concentration of solids is increased.
This behavioural characteristic also explains the phenomenon mentioned in the earlier paper whereby the turbulent-flow friction factor of some ‘Bingham’ slurries converges towards the Newtonian line whilst that of others more nearly parallels the Newtonian line. The converging behaviour would now appear to be exhibited by low-concentration or weakly non-Newtonian slurries which are close to true Bingham plastics. The diverging behaviour is shown by higher-concentration, strongly non-Newtonian slurries, for which the yield-power-law analysis is superior.
Nomenclature
= volumetric concentration of solids in slurry (percent)
= internal diameter of pipe, m
= velocity gradient (shear rate),
| = Stanton-Moody friction factor | |
| = coefficient in yield-power-law model (see Equation (1)) | |
| = exponent in yield-power-law model (see Equation (1)) | |
| = Reynolds Number ( ) | |
| = velocity, m/s | |
| = shear velocity ( ), m/s | |
| = throughput velocity (discharge/pipe area), m/s | |
| = throughput velocity for equivalent Newtonian flow, m/s | |
| = distance from boundary, m |
Greek symbols
| = ratio of Rheogram areas: non-Newtonian/Newtonian | |
| = viscosity ( ), Pa · s | |
| = "tangent" viscosity, Pa · s | |
| = stress ratio ( ) | |
| = density of slurry, kg/m 3 | |
| = shear stress, Pa | |
| = yield shear stress, Pa | |
| = shear stress at pipe wall, Pa | |
| = term in dimensionless velocity equation (see Equations (3), (4)) |
Thomas, A. D., Unpublished data at M.D. Research Co., Sydney, Aust. (1977).
Thomas, A. D., "Coarse Particles in a Heavy Medium — Turbulent Pressure Drop Reduction and Deposition under Laminar Flow", Proc. Hydrotransport 5, BHRA Fluid Engineering, Cranfield, U.K. (1978).
Thomas, A. D., "Slurry Pipeline Rheology", 2nd National Conference on Rheology, Sydney, Aust. (1981).
Thoms, D. G., "Non-Newtonian Suspensions Part II. Turbulent Transport Characteristics", Ind. Eng. Chem. 55(12), 27-35 (1963).
Tuft, P. B. R., Unpublished data at M.D. Research Co., Sydney, Aust. (1977).
Wilson, K. C. and A. D. Thomas, "A New Analysis of the Turbulent Flow of Non-Newtonian Fluids", Can. J. Chem. Eng. 63, 539-546 (1985).
Manuscript received May 26, 1986; revised manuscript received September 22, 1986; accepted for publication September 24, 1986.